Submitted: 30 March 2017. Accepted: 30 July 2017.
Rapid damage assessments are surveys carried out by trained emergency services personnel in the immediate aftermath of disaster events. The surveys assess the condition of buildings in damaged areas so that emergency assistance can be efficiently managed and dispatched. The surveys are generally carried out on foot (by helicopter in remote areas) via handheld electronic devices. Each building is assigned a rating of ‘no damage’, ‘minor’, ‘moderate’, ‘severe’ or ‘total’. Minor damage generally includes damage less likely to affect habitability of the structure (e.g. guttering, fencing) while severe/total damage means the occupant will need temporary accommodation (e.g. roofing and other structural failures). In addition to the building condition, information is recorded for building type (e.g. home, commercial), number of stories, immediate hazards (e.g. ceiling collapse), animal welfare, water height (if applicable) and any other recovery support requirements (e.g. medication, disabilities). In many instances, a short text description and photographic images of the damage are also collected.
The RDA survey data are by necessity less detailed than forensic engineering assessments but typically cover a much larger area (in a very short amount of time) and capture many more buildings. It is important to emphasise that the primary objective of damage assessment during the surveys is identifying life safety and recovery issues i.e. not necessarily reporting all damage relevant to a typical engineering investigation. Most surveys are conducted on foot from the street and therefore less visible damages are likely to be underreported (e.g. water ingress). Therefore, reported information on damage intensity should be considered as conservative (lower bound) for the true extent of damages. Due to the nature of QFES objectives, RDA surveys are carried out in areas where damage poses a potential threat to life safety (e.g. Figure 1). This means they do not necessarily represent a uniform assessment of damage to structures in all impacted areas. However, in areas surveyed they are largely comprehensive.
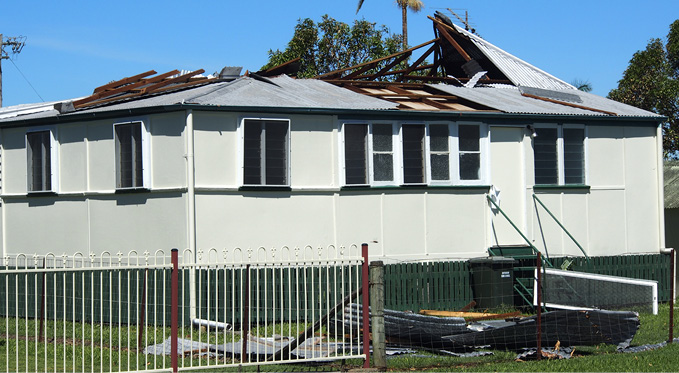
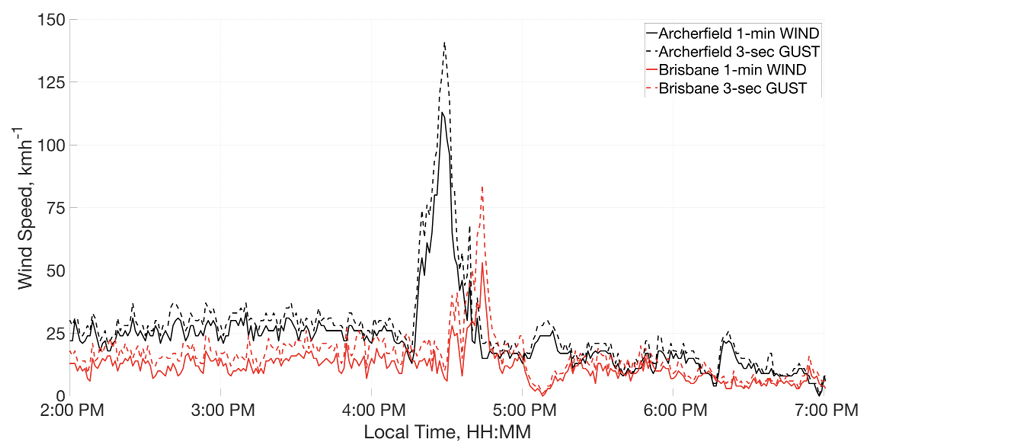
On 27 November 2014, an intense supercell struck southeast Queensland with maximum three-second gust wind speeds of 141 km/h and hailstones the size of tennis balls (ICA 2017). While damaging winds did not reach ultimate design limits specified by AS/NZS 1170.2 (Standards Australia 2011) for residential housing, the 141 km/h wind gust recorded at the Archerfield Airport Bureau of Meteorology (BoM) Automatic Weather Station (AWS) was the second highest wind speed ever observed at that station. Furthermore, the supercell led to insurance losses of approximately $1.4 billion, making it the costliest Australian natural catastrophe in 2014 (ICA 2017).
At the time of the event, a BoM S-band Doppler radar (Mt Stapylton) and dual-wavelength research Doppler radar (CP2) were simultaneously scanning the supercell. Beneath the Doppler radar sweeps, two AWSs (Archerfield Airport, Brisbane) were also recording wind data at 10-m (Figure 2). Following the event, QFES conducted RDAs throughout affected suburbs of Brisbane to gather information about the extent of damage caused by the storm. Given the unique collection of Doppler radar, AWS and ground-based RDA data during and after the storm, the damage analysis in this study aimed to compare the lowest available (i.e. 200 m) Doppler radar data with the QFES RDA observations to investigate any relationships between these data.
Doppler radar data used in this study were collected by CP2 and Mt Stapylton Doppler radars, which are both S-band (10.9cm and 10.0cm respectively) wavelength systems with half-power beam widths of 0.96o and 0.90o respectively (Krupar et al. 2017). Each radar generates three base moments: reflectivity, Doppler radial velocity and spectrum width.
For the purposes of this study, only reflectivity and Doppler radial velocity data were considered. Radar reflectivity is a measure of the sum of backscattered energy that reflects off a target in the atmosphere and returns to the radar. In a thunderstorm, the reflected backscattered energy is used to assess the intensity of precipitation in decibels (dBZ), where higher values correspond to more intense precipitation (i.e. hail). Doppler radial velocities are the aggregate mean velocity, either towards or away from a radar, of a large sample of targets. Since one Doppler radar can only measure velocity along the emitted electromagnetic beam, two Doppler radars are required to retrieve three-dimensional wind fields. Since CP-2 and Mt Staplyton had overlapping scans, a dual-Doppler synthesis (Krupar et al. 2017) was performed to retrieve three-dimensional wind fields over RDA collection regions. Reflectivity and dual-Doppler velocity footprints were generated at 200-metre intervals over the lower 15 km of the atmosphere, where the 200-metre elevation is the lowest possible altitude at which the objective analysis can be performed.
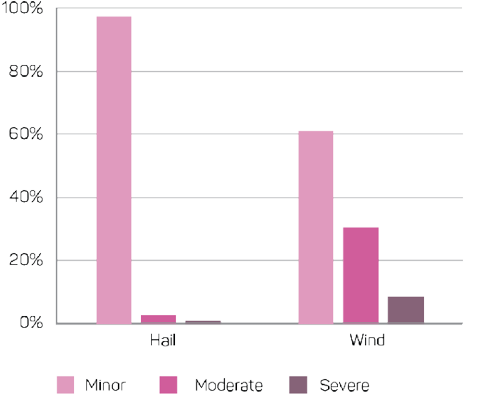
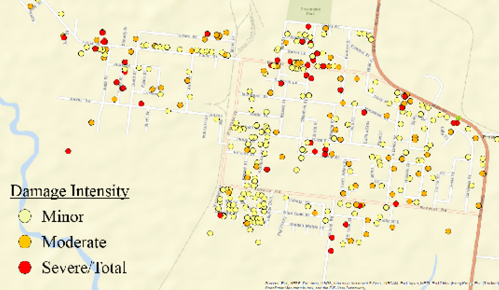
A total of 3,343 RDA data points were collected and analysed (Figure 3). To enable damage comparisons with swaths of Doppler-derived wind speeds (at 200 metre height) and radar reflectivity, RDA points were assigned hail and wind damage modes. The assignments were applied based on term searches within the damage description for each point (e.g. search for the word ‘hail’) and engineering judgement based on the presence of tree damage or debris (i.e. both would result in an assignment of wind damage). In selected areas, the damage assignments were validated by inspecting the photographs. Summary statistics for the hail and wind damage are shown in Figure 4. Of the 3,343 RDA points, 2,720 were assigned hail (2,425 points) or wind (295 points) damage modes. The most frequent observation was minor damage as a result of hail. Wind damage was far less frequent, but often moderate (e.g. failure of fascia, awnings and smaller sections of roofing) to severe in intensity (e.g. complete roof loss).
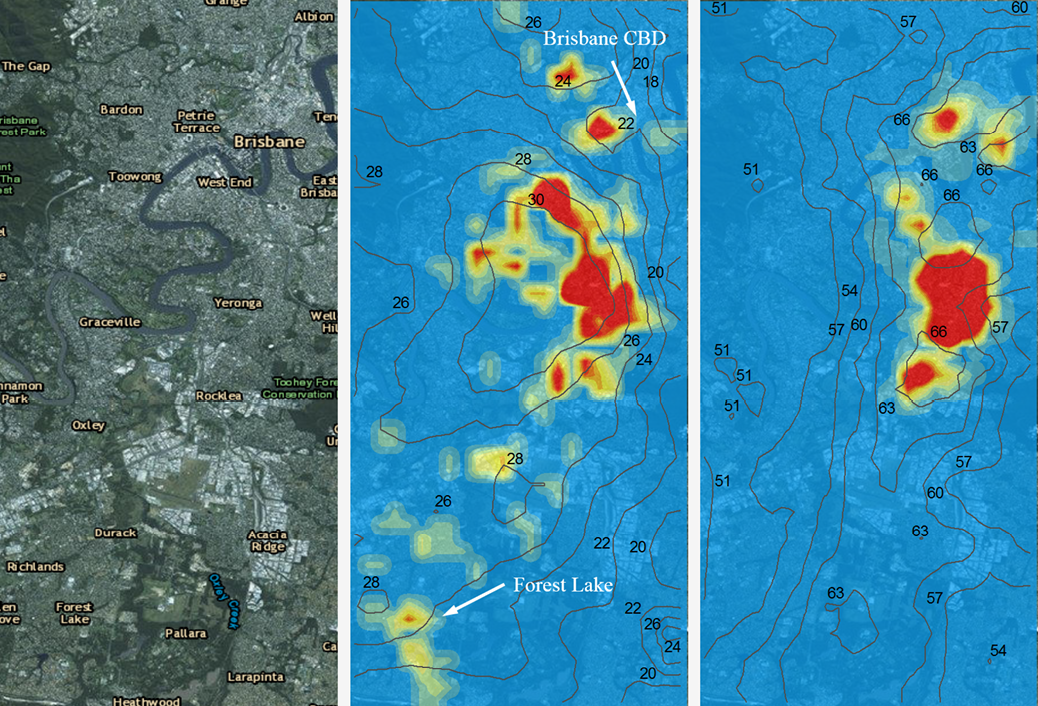
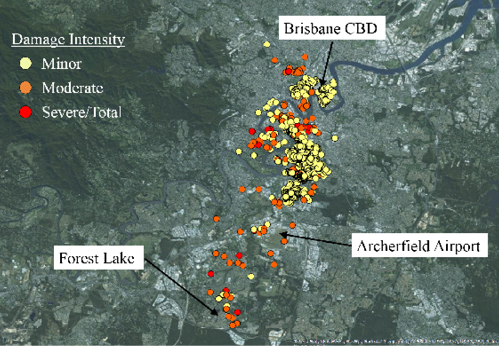 Figure 3: QFES RDA data for the November 2014 Brisbane severe thunderstorm event.
Hail and wind damage modes were compared with maximum 200-metre maximum dual-Doppler radar velocity and radar reflectivity data in Figure 5. Wind damage was observed from Forest Lake (southeast of Brisbane) through to the Brisbane central business district (CBD). Hail damage was predominantly confined to the region just south of the Brisbane CBD. As the storm propagated to the north-northeast the suburbs of Archerfield, Moorooka, Annerley, West End, Brisbane CBD, Spring Hill and Herston were worst affected. Areas of highest reported wind damage were located along the east and northeast leading edge of the thunderstorm gust front (i.e. north of Archerfield Airport) with some isolated pockets north of the observed gust front (F
Tropical Cyclone Debbie was a severe, slow moving storm with a relatively large wind field that crossed the Queensland coast south of Bowen around midday on 2
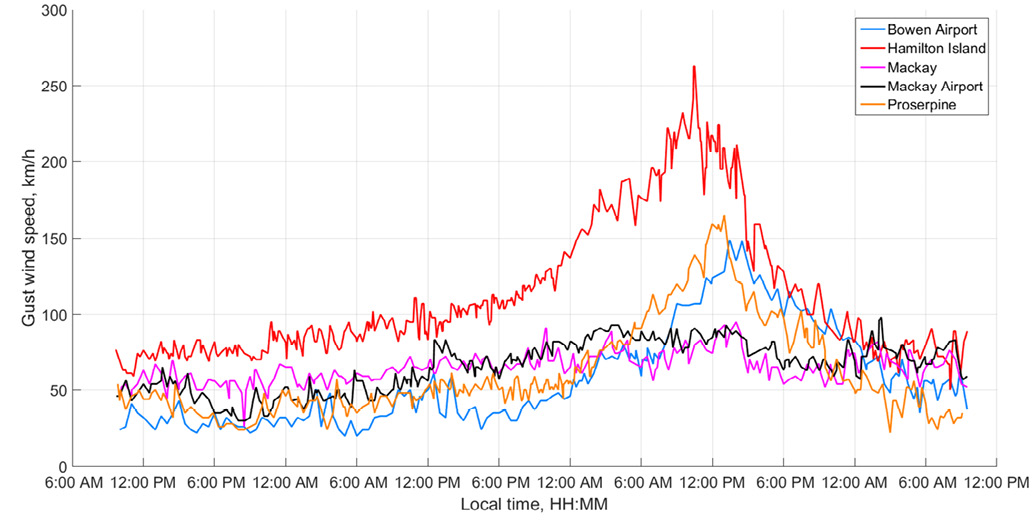
Source: Bureau of Meteorology
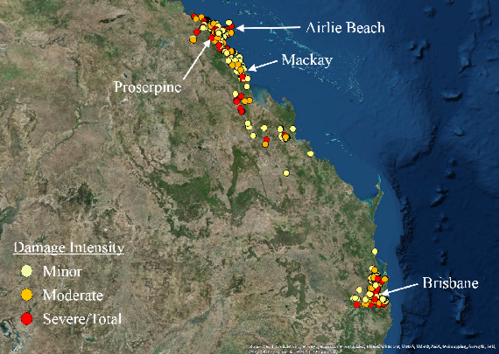
RDA data were collected and aggregated by QFES with assistance from Fire and Rescue NSW during Tropical Cyclone Debbie. Surveys in Bowen and Airlie Beach focused on damaged properties (i.e. very few surveys noted ‘no damage’). Surveys of Proserpine were more comprehensive and included an assessment of nearly all properties both damaged and undamaged. ‘Minor’ damage typically included broken windows, damaged ancillary items (e.g. fences, gutters, awnings, carports) and minor roofing or water ingress related failures. ‘Moderate’ and ‘severe/total’ damage included more extreme versions of those failures and frequent water ingress and roofing issues. Lower proportions of moderate and severe/total damages occurred in Proserpine (24 per cent) compared with Bowen (34 per cent) and Airlie Beach (45 per cent).
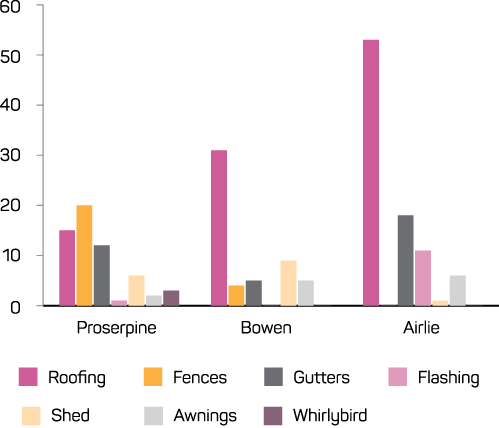
RDA data were also used to investigate relative damage proportions to building components. Figure 8 shows the distribution based on results of term searches within the damage descriptions. A high frequency of issues related to ancillary items like gutters, fences and sheds. However, of the 2,738 points that recorded damage, 799 (29 per cent) did not include any descriptive comments about the type of damage observed. Furthermore, assessments that did include comments were not always complete (may have mentioned loss of roofing but no mention of fences since roof damage was more important for that building) so the proportions presented should be considered as lower bounds. Complicating things further, all building types were included in the analysis (e.g. houses, commercial, strata) since building type was listed as ‘unknown’ in most cases. This affected the statistics for damage to components in each of the three regions (e.g. strata properties with flashing are more prevalent in Airlie Beach than in Proserpine).
Inspecting RDA data from Airlie Beach, buildings surveyed included single-family housing (46 per cent), commercial (27 per cent) and unit/townhouse (25 per cent). Water ingress was consistently noted as an issue. For example, comments like ‘106 units at resort, 40 per cent have water damage, roof gutters and flashing allowing water into units’ and ‘47 units in total, 10 have minor water damage, have lost all gutters and flashing’ were common. Of the 19 damaged strata title buildings in Airlie Beach, 10 had roofing damage, eight had significant water ingress issues and seven had damage to flashing.
The RDA survey in Proserpine was more comprehensive and enabled detailed analysis. Over 90 per cent of buildings were investigated, including damaged and undamaged properties (Figure 9). In many cases, RDA teams (Fire and Rescue NSW and QFES) knocked on doors and discussed damages with property owners. The majority of buildings were single-family homes (81 per cent), commercial (10 per cent) or unit/townhouse (six per cent). Of the 1,283 houses surveyed in Proserpin
The most frequently reported damage in Proserpine was water ingress (41 per cent of all damaged buildings). In the majority of these cases there was no mention of roof or window damage, suggesting that building envelopes were not adequately designed to resist wind-driven rain. This issue has been consistently reported in post-cyclone damage assessments conducted by the CTS for the last 40 years, including Tropical Cyclone Debbie (Boughton et al. 2017), and is well known to be a dominant form of insured loss during cyclones. Observing water ingress can often be difficult when surveys are conducted from the building exterior. Thus, the 41 per cent proportion should be considered a lower bound for the occurrence of this type of damage. For comparison, the CTS assessment of Cyclone Larry (Melita 2007) indicated that 75 per cent of homes had some form of water ingress damage. The second most common mode of damage was fencing (one in four damaged houses). Considering fence replacement costs can typically range from $1,000 to $5,000, this represents a sizeable contributor to overall losses for the region. Other frequently observed damage for Proserpine included roofing (14 per cent) and guttering (13 per cent).
RDA surveys do not include information about housing age. To examine age-dependent differences in performance, 106 moderate and severely damaged houses in Proserpine were classified by CTS as pre-1980s or post-1980s construction style. Of the 84 moderate and 22 severely damaged houses examined, 53 (63 per cent) and 21 (95 per cent) respectively were pre-1980s. This reinforces findings from previous CTS investigations (Smith et al. 2016) indicating that older housing is more susceptible to severe (structural) failures, but vulnerability is less age-dependent for lower damage states (fences, gutters).
The two case studies demonstrate the value of RDA datasets. For both events, the data provide a better understanding of the spatial extent of damage, vulnerability of various building types, frequency of damage to various building components and relative severity of damage in different areas. For the Brisbane windstorm, comparisons of RDA with Doppler radar show that the most frequent wind damage occurred along the leading edge of the thunderstorm gust front, while the most frequent hail damage occurred below or just to the west of the 200-metre 63 dBZ radar reflectivity contour. These comparisons suggest that Doppler radar can potentially be used to rapidly identify regions where damage to buildings and infrastructure are likely. For Tropical Cyclone Debbie, analysis of the RDA data highlights key differences in housing performance based on age and demonstrate the relatively high frequency of damage to ancillary building components. From a mitigation perspective, these ancillary items may be ‘low hanging fruit’ in the sense that upgrades are significantly less costly (in time and effort) than structural retrofits.
In the future, the quality of RDA datasets could be improved by ensuring that damage descriptions are provided for all assessments and by reducing the number of ‘unknown’ values nominated for building type and roof type. More Doppler radar and field measurements are required so that when events occur these data can be coupled with RDA survey data and a better understanding of building vulnerability can be gained. Creating a historical record of severe wind events with both wind field information and RDA data may lead to the future use of RDA as a calibrated estimator of wind speeds. In addition, unique datasets like these could be used to rapidly assess likelihood of damage to buildings and infrastructure in near-real time. This could help improve emergency management and financial risk decision-making.
This research is supported by funding from the Bushfire and Natural Hazards CRC.
Boughton GN, Falck DJ, Henderson DJ, Smith DJ, Paracka, K, Kloetzke T, Mason M, Krupa, RJ, Humphreys MT, Navaratnam S, Bodhinayake G, Ingham S, Ginger JD, 2017, Technical Report No. 63: Tropical Cyclone Debbie damage to buildings in the Whitsunday Region. Cyclone Testing Station, James Cook University Townsville, Australia.
Insurance Council of Australia (ICA Dataglobe) 2017. At: www.icadataglobe.com/access-catastrophe-data/.
Krupar RJ, Mason MS, Smith DJ, Soderholm J, Protat A & Gunter WS 2017, Dual-Doppler Radar, In Situ Anemometric and Ground Damage Observations of the 27 November 2014 Brisbane Supercell, in: Proceedings of the 13th Americas Conference on Wind Engineering (13ACWE).
Melita B 2007, Performance of Housing Envelope in Tropical Cyclone Larry. School of Engineering. Townsville, James Cook University.
Smith DJ, McShane C, Swinbourne A & Henderson DJ 2016, Toward effective mitigation strategies for severe wind events. Australian Journal of Emergency Management vol. 31, no. 3, pp. 33-39.
Standards Australia 2011, AS/NZS 1170.2:2011 structural design actions. Part II: wind actions.
Dr Daniel Smith is a research fellow with the Cyclone Testing Station at James Cook University.
Dr Richard J. Krupar III is a postdoctoral associate with the Center for Disaster Resilience at the University of Maryland.
Dr David Henderson is Director of the Cyclone Testing Station at James Cook University
Dr Matthew S. Mason is a Lecturer in the School of Civil Engineering at The University of Queensland.