Flood risk exists when all the components of risk, i.e. hazard, vulnerability and exposure overlap. Best practice flood risk management manages this risk through mitigating all three components of risk (Mirfenderesk, Corkhill & Lawler 2011). Hazard can be lessened through building flood mitigation infrastructure and through flood sensitive catchment management (e.g. minimising the disruption to natural surface and groundwater runoff systems). Exposure can be reduced through appropriate land-use planning and setting flood planning levels above defined flood levels. However, there is a limit to the extent that hazard and exposure can be mitigated. A flood that overwhelms all the protective measures and inundates cities is always possible. This is called residual risk and is managed through emergency management and has a symbiotic relationship with floodplain management.
Residual risk can be addressed partly through reducing a community’s vulnerability to flooding. A good flood warning system and flood emergency management operations are essential to the reduction of residual flood risk. Such measures warn people of an impending threat and assist them to protect life and minimise flood damage. Emergency management is a complicated task and requires solving a multitude of non-structured, semi-structured and ill-structured problems in a very short period of time. These problems include but are not limited to, regular forecasts of the flood situation, detection of at-risk people and assets, assessment of available response time and identification of aid delivery mechanisms. Finding instant solutions to these issues requires processing a huge amount of data in a short period of time, necessitating the use of an effective and robust decision support system.
Flood emergency decision support systems have been used by flood emergency managers for decades. In the 1980s and 1990s these systems were usually data-driven and in the form of hard copy flood maps, graphs, tables and other documents. Advances in computer technology since the 1990s have enabled developers to enhance the capabilities of these systems by incorporating computer flood models in the DDS. Due to limited computer speed at the time, these models were limited to point forecasting, based on lumped hydrological modelling (Caddis et al. 2015, Moffett et al. 2015, Smythe, Newell & Druery 2015). This means that model forecasts were limited to the prediction of water levels at a few critical locations in a catchment. A more effective flood emergency management system is better served by surface forecasting, i.e. predictions of water level, flow velocity, and time history of variations of these parameters at every location of risk within a catchment. Point forecast shortcomings have been addressed partly through interpolation of point forecasts and using ‘precooked’ and historical flood maps as a surrogate for surface forecasting. This approach has a number of limitations. It lacks accuracy, is limited to maximum flood surface, and lacks any information about the timeline of flooding and its temporal and spatial evolution throughout the flood event.
Computer technology advancement and the development of GPUs (primarily used for fast-moving computer games) are now used to solve the governing differential equations of flood flow. This has significantly reduced solution computations times, thereby providing a unique opportunity for the developers of DSS to incorporate fully dynamic surface forecasting capacity into contemporary systems. A review of literature shows this capacity has not as yet been fully integrated into flood emergency DSS.
One of the contributions of this study to the body of knowledge is to demonstrate applicability of GPU computing technology in flood emergency DSS development. This study describes the development of a new generation flood emergency DSS for the Gold Coast that is capable of model-based surface forecasting. This system provides emergency managers with model-based surface forecasts and flood evolution timelines at every at-risk location within a catchment. This is a capability that DSS developers could only dream of a few years ago.
In terms of communication, flood emergency decision support systems have undergone substantial changes in years. This has been due to the advances in communication technology. A proliferation of web-based applications coinciding with the availability of ever-increasing Internet bandwidth has enabled DSS developers to communicate the outputs of DSS more effectively and to a increasing number of audiences (Smyth, Newell & Druery 2015, Hart, Milligan & Reichard 2015, Powter, Rose & Gray 2015, Caddis et al. 2015, Moffett et al. 2015, Salter et al. 2015, Druery & McConnell 2015, Mifenderesk 2009, Mirfenderesk & Cox 2010). The majority of the contemporary flood emergency DSS employs proprietary web page applications to provide flood forecasts via mobile devices. It can be said that current DSSs are in step with technology. The contribution of the proposed system to the body of knowledge is that it demonstrates that the communication element of a DSS can be built based on open source web applications. This makes the development, operation and maintenance of DSS more affordable and accessible.
Research of literature shows that there is little consensus regarding the definition of a decision support system (Sauter 1997, Parker & Al-Utabi 1986, Simonovic & Savic 1989, Thierauf 1988, Guariso & Werthner 1989). In the context of this paper, a DSS is defined as ‘an interactive computer-based system that helps emergency managers in tactical and strategic decision-making during a flood emergency’. It helps decision-makers use data and predictive models to identify problems and identify steps in decision-making to solve a wide range of emerging problems (unstructured, semi-structured, ill-structured and structured) that they may confront during a flood emergency.
The development of a DSS starts with understanding the needs of the people who are going to use the system and working backwards, ensuring that these needs are met. To do this the elements of an ideal DSS are its:
A warning should be timely and issued only when an action is required. The scope of warning should be limited to the area of interest. Regular status reports of the weather or river conditions over a large area that requires no action can cause fatigue in emergency managers. The language used for warnings should be easy to understand.
The information should be complete. Complete information must answer three fundamental questions, i.e. who needs help, how much time is there, and how the help can be provided. This requires identifying:
In effect water level hydrography at the location of any vulnerable asset and all roads connecting to vulnerable assets needs to be forecast.
It is important to convey accurate information to emergency managers and to the community. An underestimation of a threat can result in damage and possibly loss of life. Overestimation of a threat gradually erodes community confidence and causes public complaint regarding the adverse effect of inaccurate information on their property values.
Emergency management is a time critical exercise and the speed of information flow can make or break an operation. A DSS needs to be flexible and respond quickly to any type of question. There is always a trade-off between speed, accuracy and comprehensiveness of information.
Flexibility allows decision-makers to map alternative scenarios so as to answer ‘what if’ queries. Decision-makers should be guided by most optimistic, most pessimistic and in-between scenarios through using the results of these ‘what if’ exercises.
Local authorities are responsible for assessing the impact of natural hazards on their communities, and, as such, they are the main users of flood emergency decision support systems. Local governments generally have limited resources and may not be equipped adequately to deal with complex systems. Such systems will generate high overheads for their maintenance and operation and usually become too costly for a typical local authority. Thus there is a need for open and shared systems integrated with local corporate systems to promote ease of maintenance and corporate ‘buy in’.
A DSS should provide a user interface that allows the user to interact with the system and allow for the incorporation of the subjective assessments of system operators and users. Such an environment allows the user to obtain answers to ‘what if’ scenarios.
The Gold Coast City Council uses a fully automated flood emergency DSS in four tiers. Each tier of operation is triggered by the previous tier and the comprehensiveness of the output information increases progressively with each tier. The system has two modes of forecasts, namely data-driven and model-driven modes. A communication-driven module facilitates communication of information between the system and its users. The data-driven module is operated in Tier 1, the model-driven module is operated in tiers 2 and 3. Tier 2 provides point forecasts and Tier 3 provides surface forecasts. The communication-driven module is operated in Tier 4. A schematic of the proposed DSS is shown in Figure 1.
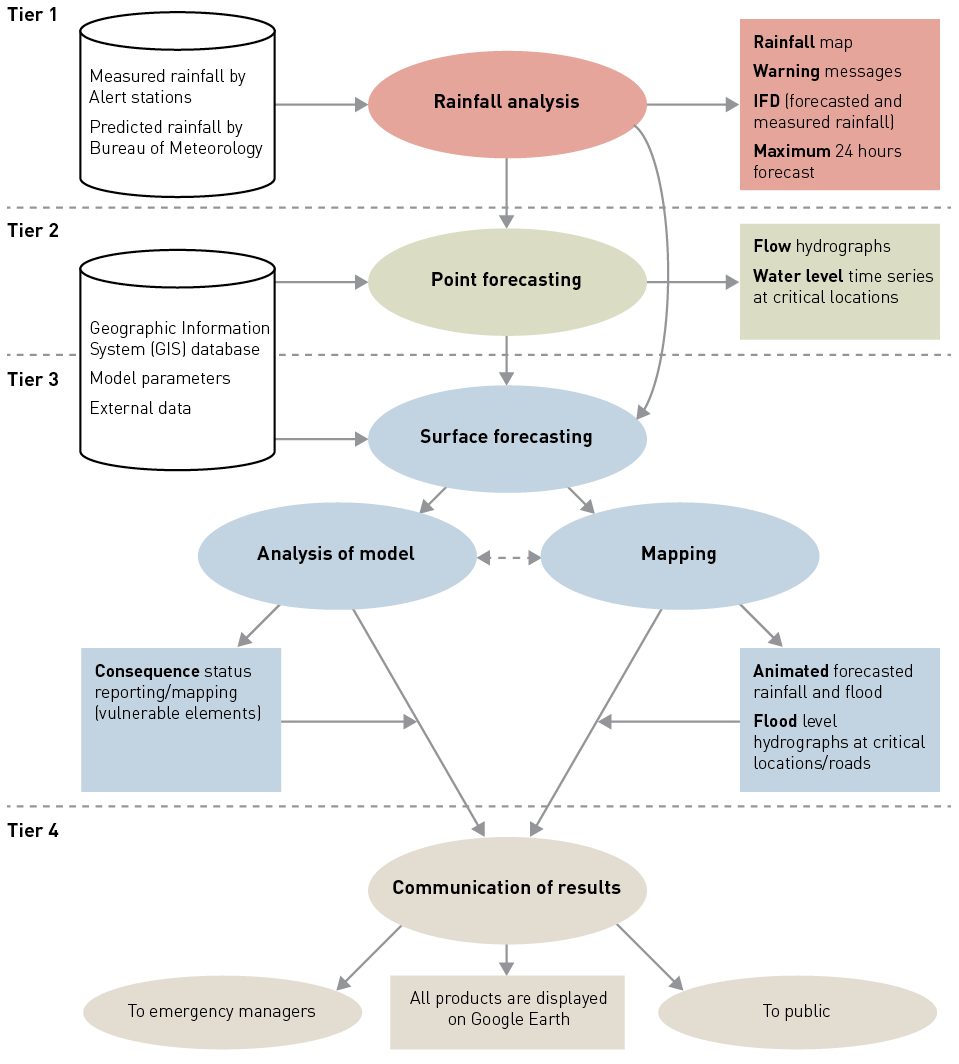
The tiered and modular nature of the proposed DSS helps better use of resources during a flood event and minimises fatigue during a lengthy flood emergency. Every tier deals with a certain degree of risk and mobilises resources in proportion to the risk.
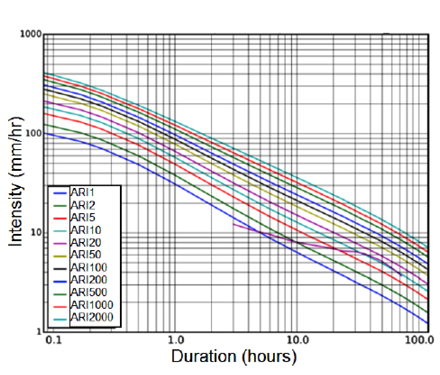
1. Tier one – rainfall analysis (warning module).This is a data-driven module that has the capacity for data warehousing, data processing and information analysis. The information generated at this tier answers the question ‘should the Disaster Coordination Centre be mobilised’. This information is generated automatically in a fraction of a second. This module automatically interrogates more than 80 ALERT rain gauges across the city. It then undertakes a frequency analysis of the measured data and compares it to historical statistical data by using Intensity-Frequency-Duration (IFD) curves for each gauge location. These curves can be downloaded from the Bureau of Meteorology for any location. In parallel the system downloads rainfall forecasts from the Bureau of Meteorology web page and generates catchment-based IFD curves for each catchment of the city. The system analyses both sets of IFD curves. Once the measured and predicted rainfalls cross certain exceedence thresholds, the system automatically sends warning messages to emergency managers. The frequency of this exercise can be set at any rate, depending on the situation. For the Gold Coast City Council this is done hourly. Figure 2 shows one of the typical graphic outputs of this module.
2. Tier two – point forecasting module. This module is model-driven and has an emphasis on access to and operation of hydrological models and analysis of their outputs. This module is triggered once Tier 1 issues a flood warning. The information generated in this tier answers the question ‘are the consequences of an impending flood high enough, requiring actions such as evacuation’. Information at the second level is generated in less than a minute. This module comprises of two main elements:
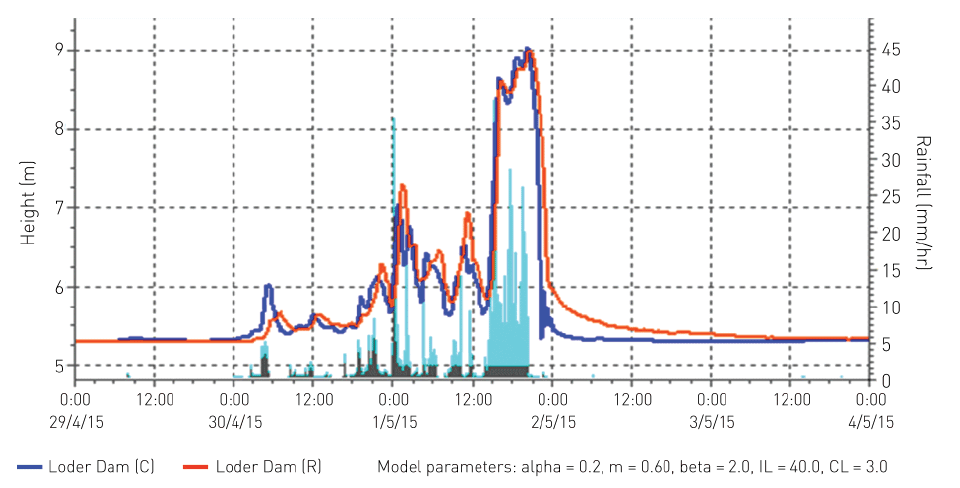
Figure 3 shows a typical output from this tier. The graph shows the recorded and predicted flood profile at a large detention basin based on the recorded rainfall (shown as light blue bars). The proposed DSS produces graphs similar to Figure 3 at all critical locations across the city in a matter of minutes and sends them automatically via email to decision-makers.
3. Tier three - surface forecasting module. This is a model-driven module responsible for the generation of comprehensive information regarding the consequences of an impending flood. This module provides emergency managers with all the information they need for informed decision-making and actions, such as rescue and evacuation operations. This module is comprised of two main components.
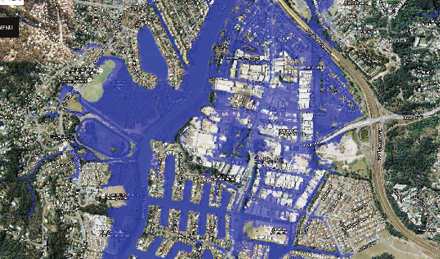
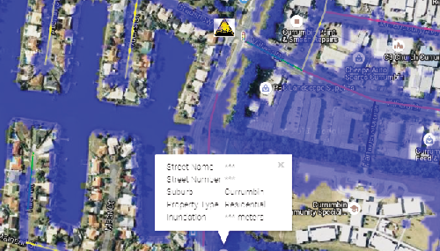
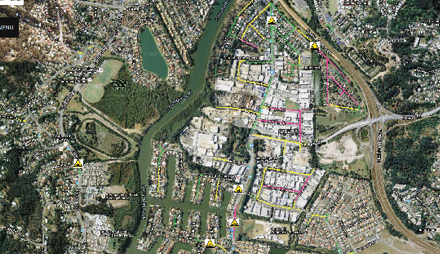
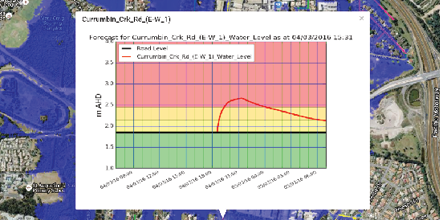
Figures 4 to 7 show a hypothetical flood. Figure 4 shows a snapshot of the surface inundation animation that is generated in Tier 3. Figure 5 shows how information on inundated houses is displayed by the system. Figure 6 shows how the system generates a global picture of inundated roads. Every colour is associated with a level of inundation. Figure 7 shows how by clicking on any point of interest a time series of water level variation will pop-up on the window. It shows when water depth on a road passes 30cm and 60cm thresholds and shows when roads will be open again.
This module enables the system to be used in post-disaster recovery, as it generates the timeline of rising and falling flood levels based on two-dimensional hydro-dynamic model results. This information allows decision-makers to prioritise recovery and clean-up programs.
4. Tier four - communication module. This module is communication-driven and is designed to facilitate decentralised group decision-making. Decision-making is based on a set of comprehensive and easy-to-understand flooding and flood consequence information that is accessed via the Internet. The system allows for the exchange of information through a number of freely available web-based applications such as Google Earth and Google Maps via KML/Z files. These files can be easily emailed and once an email is received by decision-makers, a graphic display of information (KML/Z file) can be displayed using Google Earth. The display includes the following graphic materials:
This paper describes the framework and working prototype of a flood emergency decision support system (as a proof of concept) that is currently in operation and supports both tactical and strategic decision-making during a flood emergency on the Gold Coast. The study demonstrates that computing technology and Internet bandwidth has reached a level where generating comprehensive model-based surface forecasts and communicating this information quickly is now possible. The paper describes the criteria for an ideal DSS for real-time flood emergency management and demonstrates how the Gold Coast City Council’s DSS meets these criteria.
The system’s warning module (Tier 1) automatically undertakes an analysis of rainfall across the city and provides an assessment of the rainfall exceedence probability for each of the city’s catchments. This analysis is then used to estimate hazard levels and provide timely and realistic warnings to decision-makers. Warnings are only issued when prescribed thresholds are exceeded, which reduces fatigue among emergency managers due to routine issue of non-actionable warnings. This complements available warnings by state and federal agencies to the city’s Disaster Management Unit, who provide warnings based on point measurements and forecasts at selected locations for major river systems.
The proposed system achieves comprehensiveness and accuracy using surface forecasting of two-dimensional hydro-dynamic modelling. Two-dimensional modelling is the only viable option for achieving spatially-accurate forecasts particularly in tidally influenced floodplains. The outputs of a real-time two-dimensional model contain all the information that an emergency manager may require, in particular the timeline of events, such as when access to a particular vulnerable asset will be cut off and for how long. The accuracy is further enhanced as the system allows real-time calibration of hydrological modelling using observed rainfall.
The proposed system achieves the required speed by using the latest hardware (GPU) and software technology for modelling and analysis of information. The system can produce point forecasts in the matter of minutes and surface forecasts between 10 and 30 minutes, depending on the location and type of required information. These run times will be further reduced in the near future with the ongoing development of this technology.
Ease of construction, operation, maintenance and communication of the proposed system is achieved by leveraging corporate IT maintenance systems, using open source software and maximising the use of existing tools where available.
Flexibility of the system is achieved through an effective user interface. Users can interact with the system and undertake ‘what if’ scenarios. System output is available to users via the Internet in graphic form and in an easy-to-understand style. The capacity for undertaking ‘what if’ scenarios also makes the system suitable for emergency planning exercises.
The proposed framework improves contemporary DSS in the field of flood emergency management by inclusion of a model-driven module for real-time two-dimensional simulation of events. This module greatly improves the comprehensiveness and accuracy of the system. The building blocks of the proposed DSS are generally freely available and use software packages available within most local authorities. This makes the construction of such a system within the reach of most like organisations as it reduces operational and maintenance costs and greatly improves cross-organisational and inter-agency collaboration.
Although the system is designed for operation during a flood emergency, it can be used for emergency planning or post-disaster recovery.
The lessons learned through developing the DSS are:
The next step for the Gold Coast DSS is to integrate the DSS with the local community and industry to maximise the tangible benefits of the system in the day-to-day business of the community. This will also guide future development.
This project was funded by the Gold Coast City Council and the Queensland Department of Local Government. The project also benefitted from prize money received from the Floodplain Management Association and NRMA Insurance.
The authors would like to thank the Gold Coast City Council elected officials and senior management for their ongoing support for this project. The success of this project is owed to the cumulative efforts of past and present staff of the Gold Coast City Council, in particular past personnel of the Waterways and Flood Management Team.
Caddis B, Kirby D, Minett A, Rasmussen P & Turnley M 2015, A flood integrated decision support system for Melbourne. Floodplain Management Association National Conference, Brisbane, Australia.
Druery C & MacConnel D 2015, Flood Forecasting – What you can do with your data? Floodplain Management Association National Conference, Brisbane, Australia.
Guariso G & Werthner H 1989, Environmental decision support systems. Ellis Horwood Limited Publishers, Chichester, UK.
Hart P, Milligan G & Reichard L 2015, Smartphone App prototype development for community dissemination of flood warning and flood mapping. Floodplain Management Association National Conference, Brisbane, Australia.
Mirfenderesk H, Corkill D & Lawler H 2011, Sustainable Flood Management Strategy for the Gold Coast, Proceedings of the 4th Healthy Cities: Making Cities Liveable Conference, AST Management Pty Ltd, pp. 110-123, Noosa, Australia, ISBN: 978-0-9808147-2-9.
Mirfenderesk H 2009, Flood emergency management decision support system on the Gold Coast, The Australian Journal of Emergency Management, vol. 24, no. 2.
Mirfenderesk H & Cox G 2010, A flood forecasting system for short duration floods. 50th Annual Floodplain Management Authorities, Gosford, Central Coast, 23-26.
Moffat S, Bolton B, Danielsson D & Springolo M 2015, Queensland’s State of the Art flood early warning system pioneered at Oakey Township. Floodplain Management Association National Conference, Brisbane, Australia.
Parker BJ & Al-Utabi GA 1986, Decision support systems: The reality that seems to be hard to accept? OMEGA International Journal of Management Science, (14).
Powter G, Rose M & Gray A 2015, Coffs Harbour flood warning system. Floodplain Management Association National Conference, Brisbane, Australia.
Salter L, Webster A, O’Connell J & Roso S 2015, TARDIS – Making rainfall and water level data accessible and useful. Floodplain Management Association National Conference, Brisbane, Australia.
Sauter V 1997, Decision Support Systems; John Wiley & Sons Inc.
Simonovic SP & Savic DA 1989, Intelligent Decision Support and Reservoir Management and Operations, ASCE Journal of Computing in Civil Engineering, vol. 3, no. 4, pp. 367-385.
Smythe C, Newell G & Druery C 2015, Flood forecast mapping sans modelling. Floodplain Management Association National Conference, Brisbane, Australia.
Thierauf RJ 1988, User-Oriented Decision Support Systems, Prentice Hall, Englewood Cliffs, New Jersey.
Dr Hamid Mirfenderesk, Don Carroll, Elton Chong, Ali Jafari, Nafis Hossain, Ryan van Doorn and Scott Vis are flood modelling and programing experts who have contributed to the development of this system.