Christchurch is the second largest city in New Zealand (population 340 000), and contributed 16 per cent of the total tourism activity nationwide prior to the September 2010 earthquake (Ministry of Economic Development 2012). Christchurch is the aviation gateway to the South Island, with 85 per cent of international visitor arrivals and departures to and from the South Island taking place through Christchurch Airport (CIAL 2012). In 2009 international tourists stayed for a total of 6.6 million guest nights in Canterbury, in addition to similar numbers of domestic visitor nights (Tourism Strategy Group 2012). Christchurch received 555 000 international visitors in 2010, compared to 398 000 in 2013 (Christchurch Canterbury Tourism 2013).
Christchurch experienced a series of damaging earthquakes in September 2010 (magnitude 7.1) and again in February 2011 (magnitude 6.3) where the destruction resulted in 185 deaths and major disruption to critical infrastructure. Two-thirds of existing hotel stock and many backpacker hostels were destroyed. The significant damage to hotels and the convention centre in the central city resulted in a major decline in the Meetings, Incentives, Conventions and Events (MICE) market, reducing this segment of the industry to five per cent of pre-earthquake levels (Hunter & Cossar 2011). The consequences of this event for the tourism industry were immediate, significant and sustained, not only for the city of Christchurch but across the tourism economy throughout the South Island.
Recovery and reconstruction of tourism infrastructure has been slow, largely because of the uncertainty caused by a significant number of aftershocks (above magnitude 5) over an extended period of time from September 2010 to December 2011. Aftershocks created extremely complex insurance issues, which also contributed to slowing the pace of recovery (Brown, Seville & Vargo 2013). As a consequence, planning for the renewal of the city took place over an extended period, and it wasn’t until July 2012 that a blueprint for the future central city was unveiled (CERA 2012). Meanwhile, the tourism industry continued to experience reduced visitor arrivals, with no prospect of significant improvement until accommodation capacity increased and the range of attractions was restored (Hunter & Cossar 2011, The Press 2012).
The experience of Christchurch differs from other natural disasters because of the on-going nature of the aftershock sequence over a period of 18 months. As a result, the events in Canterbury presented an opportunity to study tourism business impacts generated by an on-going natural disaster involving multiple events. The purpose of this paper is to provide an operator perspective on the impacts of the earthquakes on business revenue and visitation, and to draw conclusions about impacts felt across Christchurch and regional Canterbury. It also investigates how operators perceive the recovery of the industry one year on from the February 2011 earthquake. In doing so, this paper draws conclusions about the impacts experienced across the Canterbury region, illustrating the range of both positive and negative outcomes for tourism businesses as a consequence of location and business type. The findings reported here represent part of a wider program of research focussed on the outcomes of the Canterbury earthquakes for tourism. A companion paper describing recovery marketing and knowledge management (currently in review) explores communication and crisis management after the earthquakes, with specific reference to medium to long-term recovery in Canterbury as described in the Scott, Laws & Prideaux (2008) addition to the Faulkner (2001) framework for long-term recovery.
Natural disasters affect tourism destinations regularly worldwide, with recent examples such as the Japanese earthquake and tsunami (2011), Australian bushfires (2009) and floods (2011), illustrating how damaging these events can be to tourism infrastructure and tourist perceptions of affected destinations (Henderson 2002, Sharpley 2003, Cioccio & Michael 2007, Scott, Laws & Prideaux 2008, Ritchie 2009). Meanwhile tourism-reliant businesses bear the brunt of reduced visitor arrivals and have little control over the timeframe for recovery (Faulkner & Vikulov 2001). Disaster management principles have been described by Faulkner and Vikulov (2001) and Faulkner (2001) outlining several key phases for destination disaster management, including pre-event, response, recovery and resolution. Of specific relevance to this research project are the phases relating to the post-disaster recovery of infrastructure and tourism activity over the longer-term.
Crises precipitate both negative and positive outcomes during the recovery period, and act as ‘turning points’ for destinations (Faulkner & Vikulov 2001, p. 340). The Katherine floods in 1998 caused significant damage to the tourism industry in the region, and generated a range of outcomes in terms of marketing, infrastructure and investment, disaster preparedness, organisational cohesion and human resources (Faulkner & Vikulov 2001). Some of these outcomes are relevant to the Christchurch experience, particularly the positive consequences of the renewal and redevelopment of tourism infrastructure. Over the long-term, disasters have the capacity to deliver transformational change to destinations (Faulkner & Vikulov 2001) with the aim of ‘building the destination back better than it was prior to the disaster’ (Beirman, in Pforr & Hosie 2001, p. 209).
Faulkner and Vikulov (2001) describe the importance of a marketing strategy during the emergency and intermediate phases of the disaster management process. Ritchie (2009) agrees, suggesting tourism managers at regional and national levels of jurisdiction need to act swiftly to communicate with markets and to initiate marketing approaches designed to reassure visitors when it is safe to return.
The nature of the aftershock sequence in Christchurch made efforts to remarket the city impossible for a period of six months after February 2011, primarily because it was an unsafe environment for visitors. Marketing efforts by the regional tourism organisation restarted in September 2011 with a campaign promoting ‘South Island Road Trips’ to the Australian market (Christchurch Canterbury Tourism 2011). This campaign was designed to encourage visitors to arrive in Christchurch and travel around the South Island. Visitor arrivals to Christchurch increased 18 per cent in the second half of 2012, coincident with the reopening of several large hotels in the central city (Christchurch Canterbury Tourism 2013). On-going accommodation developments will see hotel room numbers increase from 4 532 in December 2012 to an estimated 6 196 by December 2015 (36 per cent increase, The Press 2013).
A postal survey was developed to capture data on business impacts and recovery one year after the February 2011 earthquake. It was distributed both within the areas worst affected by the September 2010 and February 2011 earthquakes, as well as across the Canterbury region. The worst affected area was defined using intensity maps of public ‘felt reports’ to describe how individuals and their properties were affected by shaking. Felt reports for both the September and February earthquakes were extracted from the GeoNet website (GeoNet 2011), and then a combined contour was generated that encompassed the full extent of the Modified Mercalli1 (MM) VI zones of both earthquakes (Figure 1).
Figure 1: Map of the South Island showing the Canterbury region, and the MMVI contour dividing the Impact Zone and the Rest of Canterbury.
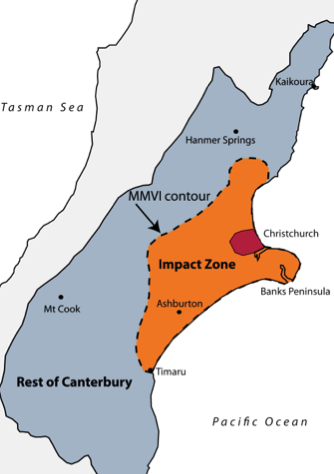
Areas within the MM VI contour were described as the ‘Impact Zone’, and those outside the contour but within the Canterbury region were called the ‘Rest of Canterbury’.
The sample included all tourism businesses involved in activity/attraction, accommodation and visitor transport throughout Canterbury. A total of 498 postal surveys were distributed to tourism business managers in the Impact Zone. Of these, 205 were valid responses and 42 were ‘returned to sender’, resulting in a 46 per cent response rate. In the Rest of Canterbury, 221 surveys were sent and 60 were returned (29 per cent response). The relatively poor response for the Rest of Canterbury group may be a consequence of the indirect nature of the earthquakes’ impacts on businesses compared to urban operators. The difference in both sample size and response rates should be noted when interpreting results.
Survey respondents in the Impact Zone came from the accommodation sector (61 per cent), activity/attraction (26 per cent) and visitor transport sectors (14 per cent). Hosted accommodation (bed-and-breakfast, farmstay, 22 per cent) and motels (14 per cent) were the largest sub-sectors in the accommodation category. The proportions of tourism businesses were similar for the Rest of Canterbury sample, however there were fewer transport companies (4 per cent). In both the Impact Zone and Rest of Canterbury, 75 per cent of businesses in the sample are micro in size, i.e. employ fewer than five fulltime, part-time or temporary staff (using the definition of Cameron & Massey 1999).
Operators were asked if the earthquakes had changed the types of visitors they received compared to before September 2010 (see Figure 2) and the relative change (increase, decrease or about the same) across four visitor groups:
Figure 2: Change in types of visitors to Impact Zone businesses.
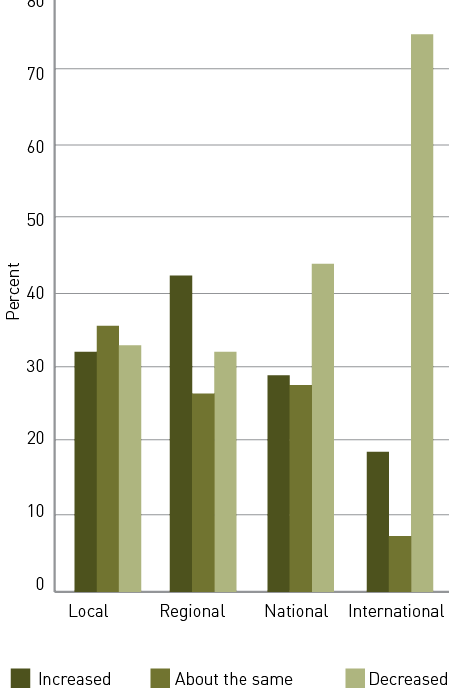
Seventy-six per cent of Impact Zone operators stated that their visitors had changed. The most striking result was the decrease in the international market reported by 75 per cent of respondents. Domestic visitors from the rest of New Zealand declined for 44 per cent of operators. In comparison, the indirect impacts of the earthquakes in Christchurch resulted in 87 per cent of Rest of Canterbury operators reporting that their visitor types and numbers had changed, with the international downturn the most notable change.
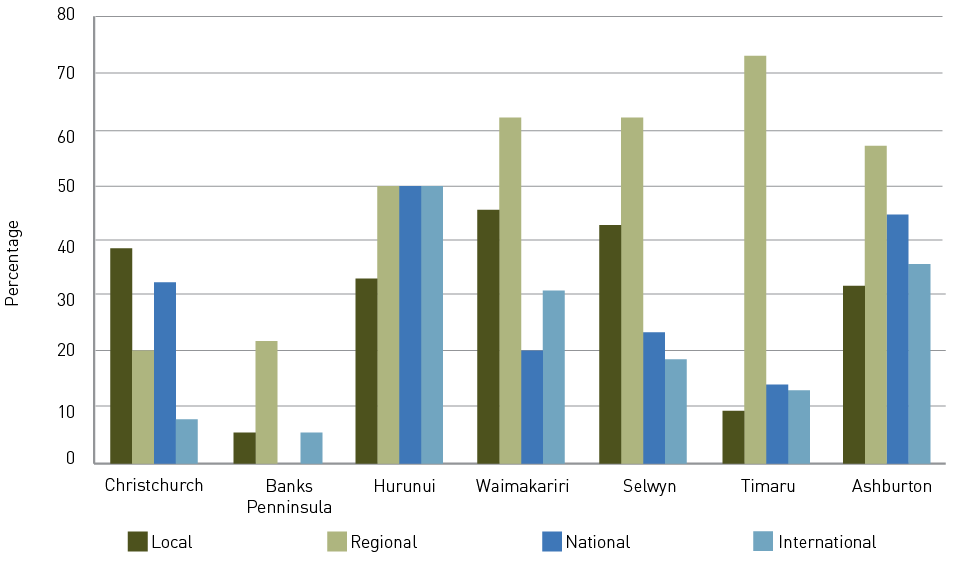
Changes in visitor types varied as a consequence of location. Banks Peninsula (located immediately south east of Christchurch, Figure 1) was particularly hard hit with declines of 67 per cent or higher across all four categories. Christchurch operators reported a very large drop in international visitor numbers (86 per cent), as did all districts to varying degrees. Figure 3 illustrates the reported increases in local, regional, national and international visitors to their business operation. Most notably, regional visitor numbers increased in Waimakariri, Selwyn, Timaru and Ashburton by 57-73 per cent, reflecting the outflow of residents from Christchurch seeking respite from the aftershocks, and escape from damaged homes and workplaces.
Figure 3: Reported increases in local, regional, national and international visitors.
Activity/attraction and visitor transport Impact Zone businesses were significantly more likely to report a decline in international visitor numbers compared to accommodation businesses that reported increases from all markets. This result reflects the reliance of Christchurch on international visitor arrivals in the summer season, with foreign visitors traditionally outnumbering domestic visitors during peak season (Ministry of Economic Development 2012). The timing of the February earthquake was particularly unfortunate for this reason, but also because forward bookings for the following summer season were affected. Activity/attraction and transport operators were especially negatively affected because of the reliance on international visitors. Accommodation businesses that remained open were in demand from the influx of relief workers and local people displaced from their homes due to building damage.
Both earthquakes resulted in decreased revenue for half of the tourism businesses in the Impact Zone sample. Interestingly, the February earthquake generated a larger proportion of ‘winners’ with increased revenue compared to after the September earthquake. This result varied across sub-sectors. Activity/attraction (64 per cent) and visitor transport (85 per cent) businesses experienced reduced revenues after the February earthquakes, and hotels (75 per cent) were the worst affected accommodation sub-sector. In contrast, motel (74 per cent) and holiday park (67 per cent) operators were significantly more likely to report increased revenue compared to any other accommodation types in the sample. This reflects the reduced hotel availability in the central city and increased demand for temporary accommodation by Christchurch residents, which created a boom for some accommodation providers. Meanwhile, for operators in regional Canterbury, the September event had only a minor impact while the February event reduced revenue for 46 per cent of operators. Thus, while the majority of businesses were undamaged by the earthquakes they suffered financial losses as a direct result of negative media and visitor perceptions of Christchurch as being unsafe and unfit to host visitors.
Changes in revenue after the February earthquake varied significantly as a consequence of business location. Banks Peninsula and Christchurch businesses suffered widespread declines in revenue after the February earthquake, with between 61-80 per cent of businesses reporting a reduction in revenue. In contrast, 56 per cent of Timaru businesses experienced an increase in revenue.
The outcomes on businesses in the aftermath of the earthquakes generated a wide spread of results. Table 1 shows that one-third of Impact Zone businesses believed they were significantly worse off after the earthquake. This made up the largest proportion of responses. However 35 per cent reported being better off. In the Rest of Canterbury group more operators reported no change in their business performance compared to the Impact Zone, however more than half reported being worse off. The Rest of Canterbury group businesses were less likely to make significant gains from the earthquakes, with only two per cent in the ‘significantly better off’ category. Chi square analysis illustrated that business outcomes were sector dependent for Impact Zone businesses. Again, the accommodation sector was significantly more likely to report positive outcomes after the earthquakes (49 per cent) compared to activity/attraction (21 per cent) and visitor transport (five per cent). Motel operators had the most positive business outcomes (72 per cent) compared to all other accommodation types, reinforcing the favourable business conditions for motel operators outside the Christchurch CBD.
Table 1: Business outcomes for Impact Zone and Rest of Canterbury operators after the earthquakes.
|
Sample |
Significantly better off |
Slightly |
The |
Slightly |
Significantly worse off |
|---|---|---|---|---|---|
|
Impact Zone |
13% |
22% |
13% |
21% |
30% |
|
Rest of Canterbury |
2% |
20% |
27% |
33% |
18% |
Operators were asked two questions investigating their perceptions of tourism recovery (Table 2). Perceptions of the industry bouncing back to pre-earthquake levels were generally negative, illustrating a widespread perception of the slow recovery of the tourism industry (bearing in mind that the survey was conducted 17 months after the first earthquake in September 2010). In contrast, ‘Our business is still struggling’ produced a wider spread of opinion in the Impact Zone, with 53 per cent agreeing and 46 per cent disagreeing, with similar perceptions in the Rest of Canterbury sample. Accommodation providers in the Impact Zone were significantly more likely to disagree that their business was still struggling (58 per cent) compared to visitor transport (23 per cent) and activity/attraction (32 per cent) operators, illustrating the range of outcomes for both ‘winners and losers’ in the post-earthquake environment. These results also highlight that while regional Canterbury was not directly impacted by earthquake damage, the indirect affects on visitor flows had a major impact on their business, with many still reportedly struggling a year on from the February event.
Several questions regarding preparedness for future disasters were used to investigate whether the experience of the earthquakes had prompted operators to improve business crisis and emergency planning. Almost half the operators did not have a back-up of Information Technology systems for their business. Slight, but statistically insignificant increases in disaster and crisis planning after the earthquakes were noted. Operators commented they had little time for planning, instead relying on their ability to react to situations as they present themselves, with the majority reporting they are happy with their current level of preparedness. Faulkner and Vikulov (2001) highlighted improvements in disaster preparedness as a positive outcome of the Katherine floods, however one year on from the Canterbury earthquakes, few operators had made significant steps towards improving their business planning for disasters. It is likely operators have been otherwise engaged with surviving in a very challenging operating environment, alongside a perception that they had experienced a once-in-a-lifetime disaster and may not need to test themselves against another significant earthquake in the immediate future.
Table 2: Response to two recovery questions on a four-point scale.
|
Recovery question |
Sample |
Strongly agree |
Agree |
Disagree |
Strongly Disagree |
Don't know |
|---|---|---|---|---|---|---|
|
'The tourism industry has bounced back to where it was prior to the earthquakes' |
Impact Zone |
2% |
4% |
35% |
53% |
7% |
|
Rest of Canterbury |
3% |
14% |
42% |
29% |
12% |
|
|
'Our business is still struggling' |
Impact Zone |
18% |
35% |
29% |
17% |
1% |
|
Rest of Canterbury |
10% |
34% |
44% |
10% |
2% |
The results of this study offer insights into the impacts on and recovery of tourism operators not only in the worst affected areas, but across regional Canterbury. The timing of the study one year after the February earthquake represents a period of great challenge and uncertainty for tourism operators, including a complete cessation in marketing activity, on-going aftershocks, and continued damage to the city. It also reflects a period of realisation that the former image and identity of Christchurch as a tourism destination was destroyed and that the reconstruction and reassessment of tourism infrastructure and services in the city, described in Faulkner’s (2001) model, requires many years to implement.
Tourism operators reported a range of both negative and positive outcomes for their business. For Christchurch businesses these outcomes were largely a function of business type, location and the level of damage sustained, while negative perceptions and reduced arrivals to Christchurch caused indirect damage to the wider Canterbury tourism industry. The loss of hotel and backpacker accommodation facilities in the CBD caused a boom in demand for motel and bed-and-breakfast accommodation in the less damaged outer suburbs of Christchurch. A key finding from this research was the significant change in visitor origins after the earthquakes. The international market suffered the largest drop, while the outflow of Christchurch residents seeking respite from the aftershocks was evidenced by the reported increase in regional visitors to other Canterbury destinations.
Tourism operators continue to face major challenges in responding to rapidly changing visitor markets. It is recommended that regional and national tourism marketing agencies work towards restoring the international visitor market segment for Canterbury, while also attracting domestic visitors to the region. Individual tourism businesses should participate in regional marketing efforts by developing web presences that are in-line with regional marketing approaches. It is also important for business operators to embed the lessons learned from their experience of the earthquakes into improved disaster and crisis planning for future events. The results of this research provide little evidence of this occurring one year on from the disaster.
The tourism industry in Canterbury has not achieved a new state of ‘normal’ post-disaster, nor should it be expected to. Instead, the earthquakes have resulted in a ‘turning point’ for Christchurch, with the long-term transformation of the city presenting opportunities to design and develop a vibrant and forward-thinking tourism product with greatly improved facilities, access and infrastructure.
Brown C, Seville E & Vargo J 2013, The role of insurance in organizational recovery following the 2010 and 2011 Canterbury earthquakes. Resilient Organisations Research Report 2013/4.
Cameron A & Massey C 1999, Small and medium-sized enterprises: A New Zealand Perspective. Auckland: Longman.
CERA 2012, Christchurch Central Recovery Plan. Report by the Canterbury Earthquake Recovery Authority (CERA), with Christchurch City Council. July 2012. At: http://ccdu.govt.nz/the-plan, [26 June 2013].
Christchurch Canterbury Tourism 2013, Business Plan 2013/14. At: www.christchurchnz.com/media/293280/cct-2013-14-business-plandocx.pdf, [26 March 2014].
CIAL 2012, Christchurch International Airport Ltd Annual Report 2012. At: www.christchurchairport.co.nz/media/557923/cial_annual_report_2012.pdf, [27 November 2012].
Cioccio L & Michael E 2007, Hazard or disaster: tourism management for the inevitable in Northeast Victoria. Tourism Management, vol. 28, no. 1, pp. 1-11.
Faulkner B & Vikulov S 2001, Katherine, washed out one day, back on track the next: a post-mortem of a tourism disaster. Tourism Management, vol. 22, pp. 331-344.
Henderson J 2002, Managing a tourism crisis in Southeast Asia: the role of national tourism organisation. International Journal of Hospitality and Tourism Administration, vol. 3, no. 1, pp. 85-105.
Hunter T & Cossar T 2011, Joint submission to the Christchurch City Council on the Draft Central City Plan for Christchurch released in August 2011. Date of submission: 12 September 2011.
Ministry of Economic Development 2012, Commercial accommodation monitor data for Canterbury. At: www.med.govt.nz/sectors-industries/tourism/tourism-research-data/commercial-accommodation-monitor-data, [28 June 2013].
Pforr C & Hosie P 2009, Crisis management in the tourism industry: beating the odds? Farnham, England. Ashgate.
Ritchie BW 2009, Crisis and Disaster Management for Tourism: Channel View Publications.
Scott N, Laws E & Prideaux B 2008, Tourism crises and marketing recovery strategies. Journal of Travel and Tourism Marketing, vol. 23, no. 2-3, pp. 1-13.
Sharpley R 2005, The tsunami and tourism: a comment. Current Issues in Tourism, vol. 8, no. 4, pp. 344-349.
The Press 2013, Convention Centre project pivotal. At: www.stuff.co.nz/the-press/business/8295754/Convention-centre-project-pivotal, [10 April 2013].
Tourism Strategy Group 2012, Commercial Accommodation Monitor. At: www.med.govt.nz/sectors-industries/tourism/tourism-research-data/commercial-accommodation-monitor-data, [16 November 2012].
Tourism New Zealand 2012, South Island Road Trips campaign a winner with the Aussies. At: www.tourismnewzealand.com/markets-and-stats/australia/marketing-activity/2012/04/south-island-road-trip-campaign-a-winner-with-the-aussies/, [1 April 2014].
Dr Caroline Orchiston is a Research Fellow in the Department of Tourism, University of Otago. She has a background in earth science, and her research has investigated natural hazards and their potential impact on society. More recently she has focussed on the Christchurch earthquakes and their outcomes for tourism.
Associate Professor John Vargo is a senior researcher and co-leader of the Resilient Organisations Research Programme (www.resorgs.org.nz) based at the University of Canterbury. His interests focus on building organisational resilience in the face of systemic insecurity in a complex and interconnected world.
Dr Erica Seville is co-leader of the Resilient Organisations Research Programme (www.resorgs.org.nz), which has been researching what make organisations resilient in the face of major crises since 2004. Erica is a director of Risk Strategies Research and Consulting and an Adjunct Senior Fellow with the Department of Civil and Natural Resources Engineering at the University of Canterbury.
1 More detail on the Modified Mercalli Scale can be found at http://info.geonet.org.nz/display/quake/New+Zealand+Modified+Mercalli+Intensity+Scale MMVI results in minor damage to some buildings, with shaking felt by most people, and some damage to interior of houses.