Sandbagging is one of the most well-known and widely used methods of defence against floodwaters (Commonwealth of Australia 2009b). It has been used for centuries around the world with little change in technology and practice (US Army Corps of Engineers Northwestern Division 2004). Materials are generally easily available (all that is needed are bags and sand) and is often cheap for individuals or local authorities (Carmarthenshire County Council 2013). If bags are filled and placed correctly and in time, sandbags can be effective against floodwaters. Despite this, there is relatively little documentation about sandbagging practice beyond ‘how to’ guides provided by different stakeholders.
There are, however, three areas of literature relevant to this paper. First, there is the broader literature about flooding intensity, frequency and preparedness (e.g. Daliri et al. 2013, Li et al. 2014). Second, there is the literature relating to social and community capacity in flood response (e.g. Mishra, Mazumdar & Suar 2010, George & Wambura 2013). Finally, there is the fledgling literature relating to the development and use of simulation tools in developing community capacity, awareness and preparedness in a variety of situations (e.g. Mustapha, McHeick & Mellouli 2013, Moore at al. 2011).
Changes to climate and settlement mean that flooding events are predicted to become more frequent and more severe with costs already exceeding $420 million per year from damage to property and livestock and serious injury or death (Commonwealth of Australia, 2009a, Garnaut 2008). However these impacts can be reduced by individuals and communities ensuring they have the ability and capacity to respond in a flood event. This preparedness invariably involves two main themes:
A recent evaluation of a flood event in NSW found that there is still an issue with the development of social capital, both in institutions and the community. Unless this is addressed, little can be done to develop an efficient response to flooding events (Manock et al. 2013). Community (and institutional) education has been identified as having a role to play in overcoming limited social capital (Commonwealth of Australia 2009a, Molino & Huybrechs 2004).
In recent years, there has been increasing use of simulation tools to help improve the ability of communities to prepare and respond to a variety of emergency situations (e.g. Schoenharl & Madey 2011). For example the World Health Organization uses simulations to prepare and understand how different health outbreaks could unfold and how different responses may or may not work (WHO 2008). Similarly, a number of communities have developed simulation tools to improve capacity and responses to adapting to changing climate impacts. To date there has been limited development of simulation tools with regard to sandbagging.
This paper addresses the gap in research regarding sandbagging by presenting a simulation tool, which has been specifically developed to explore the implications of the use of sandbags for various flood scenarios. Current sandbag planning practices were considered before the development and application of the simulation tool and the implementation of a case study.
Planning for sandbagging is typically done at a local or regional level, although strategies have been developed at the federal level in Australia (Commonwealth of Australia 2009a). Many local authorities and emergency response agencies have developed plans with a hierarchy of activities to implement in a flood event (Victoria SES 2013) incorporating the use of sandbags. These are generally distributed to local residents during (not prior to) a flood event (Commonwealth of Australia 2009b). It is not clear from the available online, local authority literature at what point during a flood event sandbags are distributed and how residents find out that they are available.
‘How to’ guides available online from local authorities and emergency services (Victoria SES 2013) invariably outline resources required, types of sandbags available, how to fill them (and where), the challenges of sandbagging (e.g. it is a slow and labour intensive process), and the different techniques of placing sandbags (e.g. blocking drains, building a wall) (Commonwealth of Australia 2009b).
The simulation tool described in this paper allows for the exploration of sandbagging. The tool was originally developed for the suburb of Elwood in Melbourne but can be adjusted for any area once the street maps, flood mapping, housing and occupancy data are available.
The tool is an agent-based simulation (Miller & Page 2009), which is a type of simulation system that allows the modelling of heterogeneous individuals acting autonomously within a simulated environment. This technology is especially useful for social simulations involving modelling of populations. The tool models individuals reacting to a flood situation (Figure 1). The current version is specific to Elwood, Victoria, but is adaptable to other areas. The simulation plays out over a predetermined duration. A flood warning occurs and roads and houses flood according to flood map patterns. Individuals decide whether they will collect sandbags from a depot, drive there, queue and collect sandbags, and drive home. If they encounter floodwaters on the road, they replan a new route to reach their destination. The model can be populated with individuals depending on the available population data, or with lesser numbers of individuals to achieve faster results, which can then be extrapolated.
Figure 1: Screenshot showing flood simulation with cars, houses and depots. Green houses are safely sandbagged, red houses are flooded, pink houses are partially sandbagged when floods arrive.
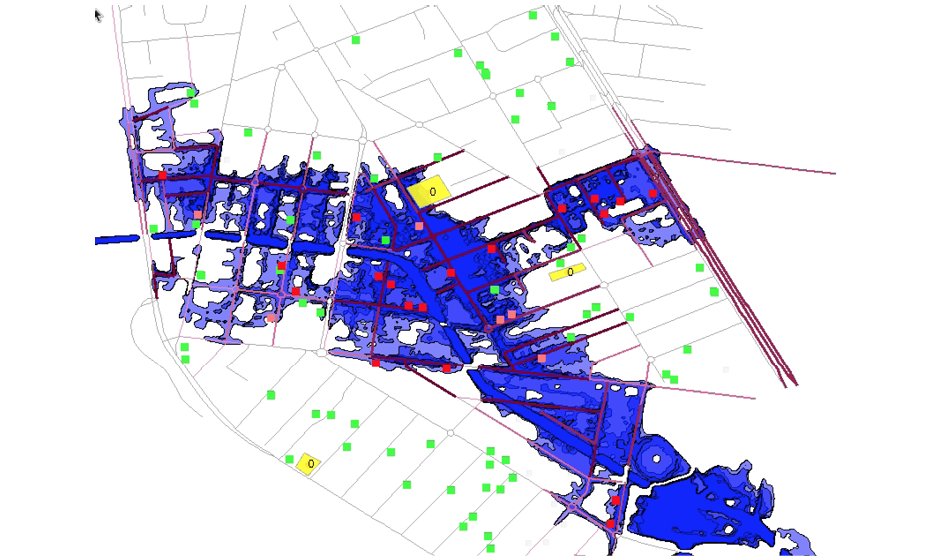
The simulation can be observed graphically showing:
In order to do a thorough analysis multiple executions should be run for each parameter setting, obtaining averages and variances, and many different scenarios must be explored. This can be done without the graphical display.
There are a number of schemas that facilitate the modelling process. A person’s engagement in the use of sandbags is assumed to vary according to how likely it is that their property had been flooded previously (measuring speed of response following a warning). Also, the simulated progress of floodwaters is not continuous, but is sufficient for analysis. Individuals become aware of road flooding only when they enter the portion of road which is affected by floodwaters. At this point the simulation replans their route, or if no option is possible, they are stranded.
Once at a depot participants queue until it is their turn, and then fill or collect sandbags for a specified period of time based on filling and loading time and number of sandbags. Once the individual arrives home further time is required for laying sandbags. If flood waters arrive at a property while it is in the process of being sandbagged it is tagged (and shown) as partially protected.
As the simulation runs data is collected and is shown at the end of an interactive simulation (see Figure 2). If multiple simulations are run in batch mode, the data is saved to a .csv file which can then be accessed using Excel or used to create analysis graphs. Key results include the number and percentage of buildings in the flooded area and the number and percentage of agents who decided to sandbag. Of these, the number and percentage of homes that were saved due to sandbagging can be assessed as well as the number and percentage of homes lost where sandbagging was too late, and the number and percentage of homes sandbagged that were not in a flooded area. The number and percentage of unsandbagged houses flooded is also calculated.
Figure 2: The results window displayed at the end of a simulation.
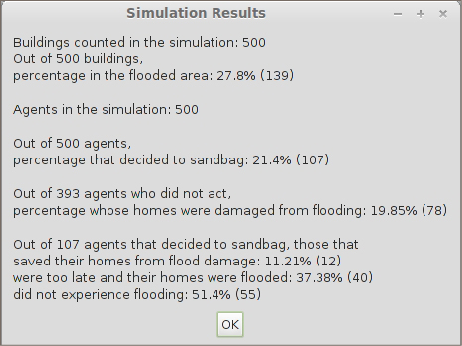
A substantial amount of additional data is collected, but not initially displayed. It is available in the .csv file for analysis, including the percentage of agents in various states at simulation end (stuck on road, in transit, waiting at depot, doing sandbagging, completed sandbagging, etc.), as well as the percentage of properties with varying status (e.g. in flood area, protected, protected and not in flood area, protected too late, etc.). Data is also collected on average waiting time at each depot and the number of residents served.
To aid understanding sandbagging scenarios alternative scenarios can be run with different settings. The main configuration settings available include:
As there is some non-determinism within the simulation (as agents make choices according to probabilities, not deterministically), there will be variance in how a scenario unfolds, even with the same parameter settings. This can be systematically analysed by running multiple scenarios with the same parameter settings, and computing both average and variance.
Due to inherent non-determinism within the model (agents make choices according to probabilities, not deterministically), there will be some variance in how a scenario unfolds each time the simulation is re-run. In order to build confidence in the outputs of the simulation it must be re-run several times for the same inputs and the outputs of these runs aggregated, computing both average and variance. This can be done using a non-interactive ‘batch’ mode of running, where the software executes a specified number of runs in succession, with no user interaction or graphical display, saving the outputs of each run to the .csv file. Results can then be loaded into a spreadsheet program for analysis.
For example, Figure 3 shows how sandbag filling time (along the bottom axis) affects such things as houses saved, or queuing times. This was produced by aggregating results from 20 simulation runs.
Figure 3: Graph showing effects of varying sandbag filling times, for a 1-in-20 year flood, and six hours of activity.
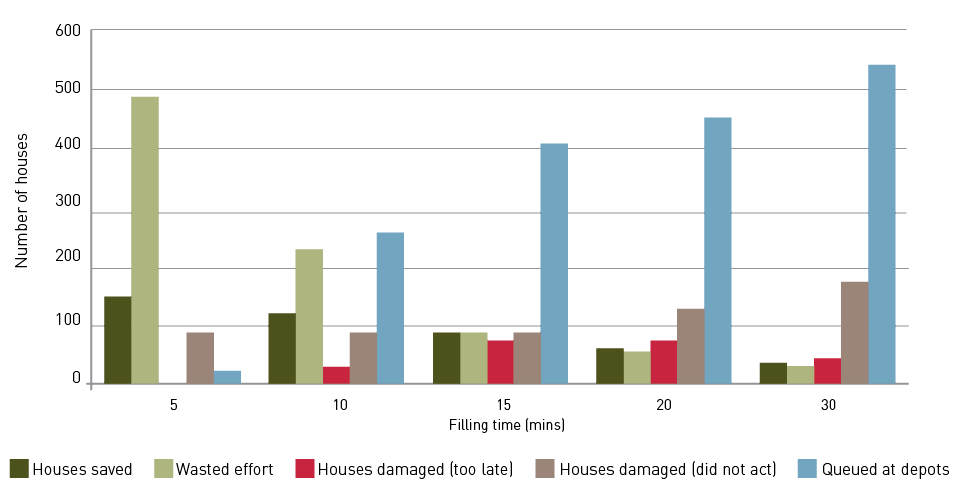
It is also useful to understand how changes in inputs cause changes in outputs and, importantly, how sensitive some outputs are to changes in certain inputs. This kind of analysis is called ‘sensitivity analysis’, and can show correlations (or lack of) that may not be obvious at the outset. Sensitivity analysis can be performed using batch mode, where instead of keeping the inputs fixed, they are systematically varied within specified ranges (such as varying the sandbag filling time between 5-30 mins in Figure 3). As before, for each input configuration that results, the simulation is re-run several times to get statistically meaningful results.
The tool can readily be customised to work for any area, using a provided software wizard and the following information:
These files must be placed in a folder for the new suburb. When the tool launches to create a new suburb, the wizard will step through the process.
The RMIT-developed tool can be downloaded from https://sites.google.com/site/rmitagents/projects/nccarf along with a detailed user guide and tutorial exercises.
The tool was developed and applied for Elwood, in the City of Port Phillip council area (CoPP), which is subject to flash flooding from a canal running through it. Over the last seven years there have been two 1-in-100 year flood events, causing millions of dollars of damage. RMIT University, CoPP, and the Victorian State Emergency Services (SES) developed and refined the tool to examine whether sandbag depots are a useful tactic to mitigate against flood damage and, if so, what might preferred locations be, and what management activities may be optimal.
Sandbagging was chosen as a known activity, one with many variables needing analysis, many of which could be explored by modelling and simulation. Initial issues included potential locations of depots, management of sandbag pick-up (multiple queues, dedicated fillers or people filling their own, allocations, parking, etc.), how much damage one might expect to prevent, considering possible timing of events (during work-day, night time, weekend, etc.), and plans to assist particular groups (the elderly, mothers with children, etc.). The researchers interviewed key emergency services experts and community members and attended community meetings to obtain a general understanding of the issues, as presented by relevant resident groups, and an idea of community behaviours. Due to the potential complexities of negotiating actual locations, issues relating to arbitrary depot locations were explored with a view to understanding the actual options at later stages. Maps were obtained from Open Maps, population details from the Australian Bureau of Statistics and flood maps from Melbourne Water. The flood maps had actual timings, so it was known how fast floods progressed in a particular flood event.
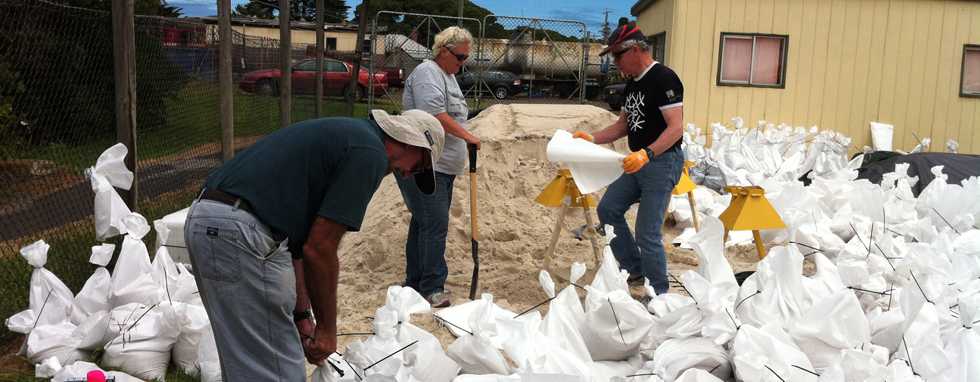
Image: Australian Historic Shipwreck Preservation Project/C. Philippou
Packing sandbags at a community sandbag depot.
An initial simulation was constructed and analysed for warning times ranging from 30 minutes to three hours. The number of filling points ranged from three to 12. Unsurprisingly, significant numbers of houses were saved only when warning time substantially exceeded 30 minutes. It also became clear that even given optimistic estimates of time required to fill sandbags (at least 12) possibly more filling points would be required to avoid people spending longer than 20 minutes on average in the queue. These initial results led SES and CoPP to conclude that sandbag depots were unlikely to be a viable strategy to implement, although local or home-based sandbagging options may well be of value. On that basis, it was decided to use the simulation in community discussions rather than do further detailed analysis.
Additional uses of the simulations include:
The tool allowed preliminary assessment of the viability of sandbagging depots as a local government approach to flood mitigation. It was determined that sandbagging would not be viable as a council or SES-led activity on a large scale. However, there was scope for further exploration of individual or local neighbourhood preparation in this way. Indeed this study has led to the development of an educational game1 to raise awareness of flood response activities, in particular, sandbagging. There are sand-less alternatives to traditional sandbags that could also potentially be employed by individual householders, however they were not further explored in this study.
The initial simulation tool was built and tested for warning times ranging from 30 minutes to three hours with queues ranging from three to 12 people. The results showed that significant numbers of houses were saved only when warning time substantially exceeded 30 minutes. Also, given estimates of time required to fill sandbags, at least 12 filling points would be required to avoid people queuing longer than 20 minutes. These initial results indicated that sandbag depots are unlikely to be a viable flood mitigation tactic for the SES and CoPP.
This case study resulted in the development of an educational game that provides an avenue to educate and engage community members in thinking about, and ‘practising’ their responses to flash flood situations. The interactive simulation has more potential to ensure that key preparation messages are registered and retained than the use of more traditional print materials. Both the simulation tool developed and the game are most effectively used in combination with community meetings as a way to assist community members to prepare for floods. In locations where warning times may be longer than in Elwood, the simulation tool can be valuable for detailed analysis and planning regarding sandbagging depot locations, filling and pick-up policies, access arrangements, and resourcing.
This work was carried out with financial support from the Australian Government (Department of Climate Change and Energy Efficiency), the National Climate Change Adaptation Research Facility (grantEM11 05), and the Australian Research Council (grant DP1093290). The views expressed herein are not necessarily the views of the Commonwealth, and the Commonwealth does not accept responsibility for any information or advice contained herein. The tool development and case study were done in collaboration with Victoria State Emergency Service and City of Port Phillip Council.
Carmarthenshire County Council 2013, Policy for the Distribution of Sandbags during Flooding Incidents. At: www.carmarthenshire.gov.uk/English/environment/emergencyplanning/Documents/sandbag_policy.pdf [9 October 2013].
Commonwealth of Australia 2009a, Flood Preparedness. Manual 20. Canberra: Commonwealth of Australia.
Commonwealth of Australia 2009b, Flood Response. Manual 22. Canberra: Commonwealth of Australia.
Daliri F, Seraji HS, Kholghi M & Dehghanipour AH 2013, Prioritizing sub-watersheds flooding intensity for structural Damaging Flood control and managing. Desert, 18(2), pp 153-162.
Dufty N 2008, A new approach to community flood education. The Australian Journal of Emergency Management, vol 23, no. 2.
Garnaut R 2008, The Garnaut Climate Change Review. Melbourne: Cambridge University Press.
George MC & Wambura CM 2013, Community awareness, preparedness and response towards disasters: A case of Kilosa flood disaster. IMTU Medical Journal, 4(1), pp. 41-43.
Li J, Thyer M, Lambert M, Kuczera G & Metcalfe A 2014, An efficient causative event-based approach for deriving the annual flood frequency distribution. Journal of Hydrology, 510(0), pp. 412-423.
Manock I, Islam R, Hicks J, Sappey R & Ingham V 2013, Perceptions of institutional and social response to frequent flooding in an Australian rural town. Australian Journal of Emergency Management, vol. 28, no. 1.
Miller J & Page S 2009, Complex Adaptive Systems: An Introduction to Computational Models of Social Life. USA: Princeton University Press.
Mishra S, Mazumdar S & Suar D 2010, Place attachment and flood preparedness. Journal of Environmental Psychology, 30(2), pp. 187-197.
Molino S & Huybrechs J 2004, Do education strategies sink and communities swim? Evaluation of the Woronora preparedness strategy five years on. Australian Journal of Emergency Management, vol. 19, no. 2.
Moore M, Gilles D, Piotrowski J & Young N 2011, Community-based Tools for Communicating Flood Risk and Improving Public Preparedness [online]. In: Valentine, EM (Editor); Apelt, CJ (Editor); Ball, J (Editor); Chanson, H (Editor); Cox, R (Editor); Ettema, R (Editor); Kuczera, G (Editor); Lambert, M (Editor); Melville, BW (Editor); Sargison, JE (Editor). Proceedings of the 34th World Congress of the International Association for Hydro- Environment Research and Engineering: 33rd Hydrology and Water Resources Symposium and 10th Conference on Hydraulics in Water Engineering. Barton, ACT: Engineers Australia: pp. 286-291.
Mustapha K, McHeick H & Mellouli S 2013, Modeling and Simulation Agent-based of Natural Disaster Complex Systems. Procedia Computer Science, 21(0), pp. 148-155.
North MJ, Collier NT & Vos JR 2006, Experiences creating three implementations of the repast agent modeling toolkit. ACM Transactions on Modeling and Computer Simulation (TOMACS), 16(1), pp. 1-25.
Schoenharl T & Madey G 2011, Design and Implementation of An Agent-Based Simulation for Emergency Response and Crisis Management. Journal of Algorithms & Computational Technology, 5(4), pp. 601-622.
US Army Corps of Engineers Northwestern Division 2004, Sandbagging techniques. Portland: US Army Corps of Engineers Northwestern Division.
Victoria SES 2013, FloodSafe. What to do during floods. At: www.ses.vic.gov.au/prepare/floodsafe/what-do-do-in-a-flood, [25 October 2013].
WHO 2008, World Health Organization Outbreak Communication Planning Guide. Geneva: World Health Organization.
Professor Lin Padgham is a Professor in Artificial Intelligence and Professor Ralph Horne is Professor and Director of Research in the College of Design. Dr Dhirendra Singh and Dr Trivess Moore are both Post-doctoral Fellows in the Schools of Computer Science and Global and Urban Studies respectively. Lin Padgham and Ralph Horne lead a cross disciplinary research team of computer science and social science.
1 Simulation game at https://sites.google.com/site/rmitagents/projects/nccarf.