Command and control (C2) is an essential part of all emergency management operational activity. It is the means by which an incident commander, being responsible for all aspects of an emergency response, recognises what to achieve and the means to ensure that appropriate actions are taken. C2 helps the incident commander achieve organised engagements in emergency management through coordination of the incident management team, application of resources, and dissemination of information.
Good C2 aims to reduce ambiguity in situational awareness in emergency response operations so that responders can decide on an appropriate course of action to positively shape the situation. An incident commander may reduce ambiguity by acquiring more knowledge of the situation, but it takes time to gain and process information. Unfortunately any C2 system also needs to be fast, at least faster than the situation’s rate of deterioration. In a firefighting scenario [1] for example, the fire will grow if the fire is spreading faster than the rate at which firefighting units can cover the ground. The resulting tension between coping with uncertainty in situational awareness and time constraints presents a fundamental challenge of C2.
An essential element of a C2 system is its organisation of people [2] working to achieve the commander’s intent through formal processes, networks, and the application of sensors and appropriate assets. An incident command system (ICS) is such a C2 structure designed to improve emergency response operations of all types and complexities. Emergency management requires the mobilisation of a command structure of personnel to control the incident. Individuals gather information, make decisions, take action, communicate, and cooperate with one another in the accomplishment of a common goal. Not surprisingly, an ICS sometimes fails to respond immediately to an incident due to the individuals lacking coordinating abilities required to effectively and efficiently manage resources. The cognitive and cooperative skills of the individuals working in concert towards the same goals could ultimately determine the success or failure of emergency response operations [3].
Whilst an ICS aims to ensure unity of effort for command and control of emergency response, coordination of members is as important as the formal chain of command. Communication between responders is vital and could influence response performance. Without adequate situational awareness or communication of the actions taken by relevant units, there is difficulty in the incident management team to work coherently to achieve the overall goals. It is recognised that failure to adequately respond to large-scale disasters is often not a problem of insufficient resources or technology, but lack of coordination [4]. Causes of the failure include lack of communication between responders, slow circulation of often outdated information, and insufficient dissemination of situational data and action plans [5].
Analysis of patterns of communication can aid in understanding the effectiveness of an incident management team. Using the 2009 Victorian bushfires as a case study, we examine in this paper the social interactions for incident command and control. Representing crisis management in social networks facilitates analysis of the coordination mechanisms, providing lessons learned from the (un)coordinated response to this major natural disaster on Black Saturday.
Social network analysis provides a means of exploring the incident command system and assessing the state of actor involvement. Investigation of the social network is useful to identify the patterns of network behaviour, which may provide insights into process chokepoints and inefficient work practices. To analyse the structure, dynamics and evolution of the social networks, we focus on some key questions:
The purpose of this study was to understand how the incident management team operated and evolved over the course of the incident response on Black Saturday. This study looked at the Royal Commission reports of the 2009 Victorian Bushfires as an accurate account of the incident management team as it stood during the crisis. When investigating data collected by the reports, it is inevitable that data may be incomplete or missing due to the nature of the inquiry. This potential incompleteness of data may expose this study to the possible misinterpretations of use for social network analysis.
On 7 Feb 2009, bushfires swept through the Australian state of Victoria. Encyclopaedia Britannica offers a compelling overview of this catastrophe.
The most deadly conflagration, which claimed 121 lives, was sparked by a faulty power pole near the township of Kilmore East, 37 miles (60 km) north of Melbourne. The flames quickly jumped a major highway and roared into a forest, where they turned into a giant fireball, dwarfing the resources of local firefighters, who could only flee in its path. Aided by steep slopes and powerful winds, the Kilmore East fire raced through a series of townships, catching residents by surprise and trapping many in their homes [6].
In the aftermath of the crisis, The Australian reports on the intensity of the Black Saturday bushfires.
The Black Saturday bushfires unleashed the equivalent of 1500 Hiroshima atomic bombs on Victoria, generating their own winds of up to 120km/h, which snapped trees and created fireballs of exploding gases that surged 600m in 30 seconds ... the energy produced by the fires in just a few hours on February 7 was enough to provide Victoria’s industrial and domestic energy needs for a year [7].
Inevitably, Australia’s worst natural disaster needed immense firefighting efforts.
More than 4,000 firefighters … have worked to battle the fires. [They] were assisted by the military aid offered by the Commonwealth Governor-in-Council, and firefighters sent [from other States as well as overseas] [8].
This study is based on the account of the emergency response to the bushfires presented in the interim [9,10] and final reports [11] released by the 2009 Victorian Bushfires Royal Commission established to investigate the disaster. In particular, this paper examines the command and control arrangements on 7 Feb 2009 in response to the fire that started at Kilmore East.
This study divides the Kilmore East fire into three distinct phases. The first phase of the fire is the initial period before crossing the Hume Highway. The second phase corresponds to the period after the fire crossed the Hume Highway and continued onto the slopes of Mount Disappointment to the time Commonwealth assistance was requested. The third phase of the fire is defined as the period when the Commonwealth was requested to play a role in response and recovery from the disaster on 7 February.
Command and control in an emergency is a complex human-centric decision making process competing against time. In order to look into the responses to the 2009 Victoria Bushfires, there is a need to capture the salient features of the teamwork and the decision making processes. We therefore extracted information contained in the case study of the Kilmore East fire to provide time-stamped messages sent between firefighting units or responders on 7 February 2009. The response activities provided timed information about the state of progress by responders.
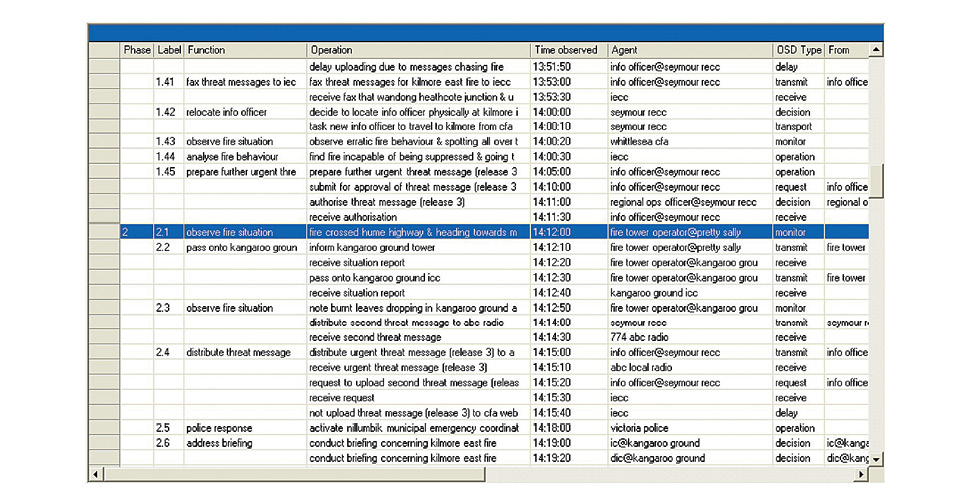
Disparate recollections of the activities were synchronised to facilitate merging into a single consolidated view for each time step. This was facilitated through the data table in Figure 1 using an analytical prototyping tool, known as WESTT (Workload, Error, Situational Awareness, Time and Teamwork) [12,13]. The data table is an ordered list of events over time together with the actors involved and the relevant details. It captures the details of individual interactions between responders (such as the description of activity, the start of events, and task duration) for further analysis of the scenario.
Figure 1. Main data table for Kilmore East Fire.
Extreme events often trigger high density of communication and interaction among actors to stimulate coherent response. The ongoing dialogue among members of incident management teams facilitates the building of shared situational awareness so that they understand what to do, by when, and whom they should contact in unexpected circumstances. Inter-organisational networks of coordinating and supporting units naturally evolve to deliver effective and collective action. These networks can play an important role in facilitating the dissemination of information within a command structure. Social network analysis views social structure as a graph consisting of nodes and edges. Actors or units are represented in the graph as nodes while edges are used to characterise the formal or informal relationships between nodes. Increasing interconnectedness may create more possibilities of multi-organisational partnerships in the wake of extreme events. The results could be utilised to improve overall emergency response effectiveness across organisational boundaries.
From the scenario described in Figure 1, Figures 2 to 4 reveal the evolving interactions between actors when responding to the Kilmore East fire. The figures indicate the interconnections between stakeholders for emergency response, regardless of the modes of communication or the context. The diagrams were produced using the tool, Pajek [14] for network analysis and visualisation. In isolation, a pictorial representation for each distinct phase of the fire allows an analyst to determine the frequency of communication between actors.
Figure 2. Social network in Phase 1.
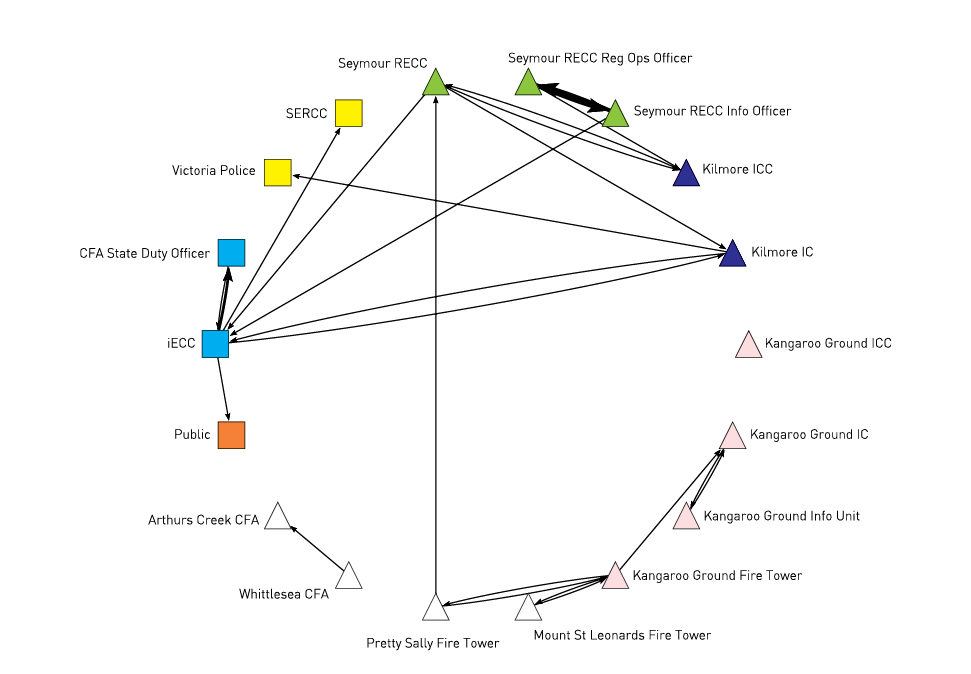
Figure 3. Social network in Phase 2.
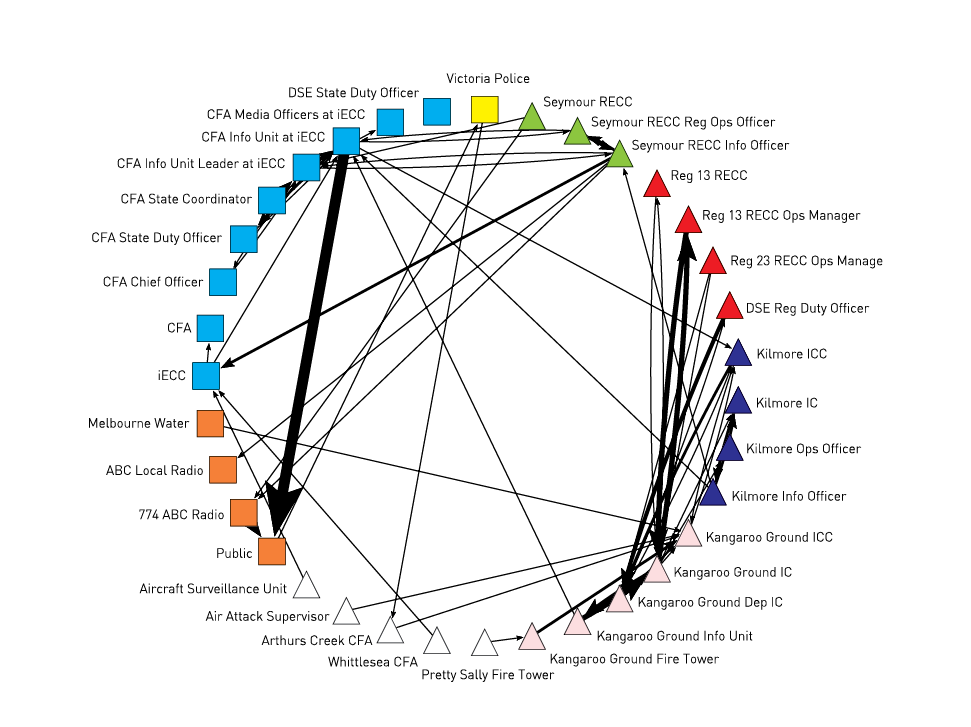
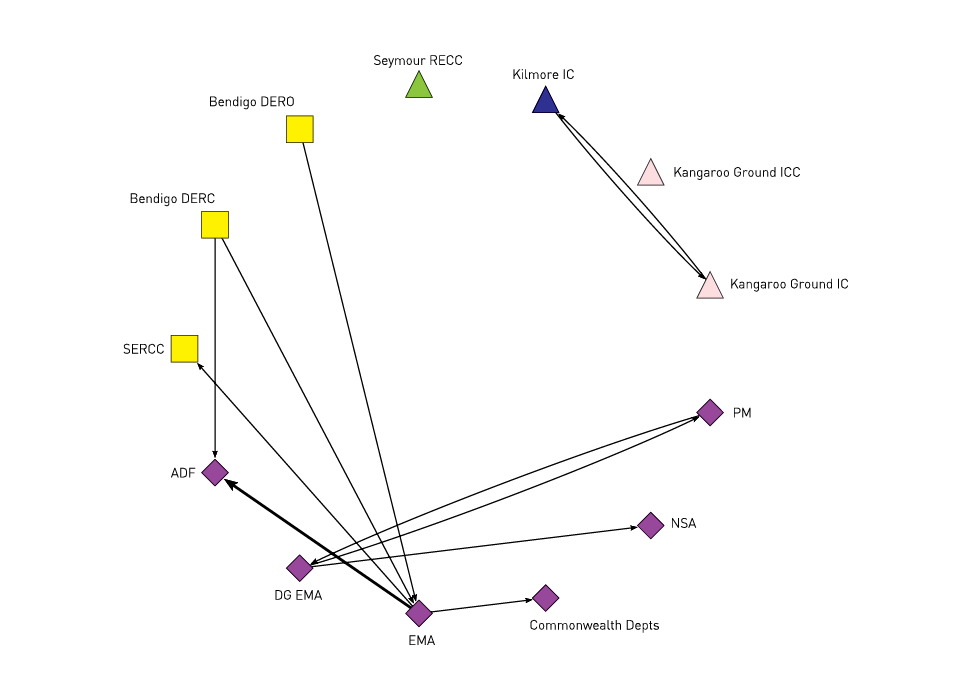
Figure 4. Social network in Phase 3.
The edge thickness reflects the amount of communication between actors. Actors are colour-coded and shaped according to their roles and the command hierarchy, respectively. The inquiry did not look into all interaction details within every functional unit, but one would infer the presence of some internal communication to facilitate information transfer. For instance, the Emergency Management Australia (EMA) should have reported to its head, Director General (DG) EMA for an executive decision to provide Commonwealth assistance.
Actors at the local level are depicted in circles. The Kilmore elements are drawn in blue circles whereas entities at various locations are represented in pink and white circles. Regional command elements are depicted in triangles, with green and red triangles representing the Seymour Regional Emergency Coordination Centre (RECC) and others, respectively. Squares are state level actors. Victoria’s fire service agencies at the state level are represented in blue squares whereas yellow squares are assigned to actors of the Victoria Police. Orange squares denote entities not belonging to emergency services such as utilities, media and the public. Finally, the Commonwealth actors are represented in purple diamonds.
From these social network diagrams, there are some nodes that appear to have higher degrees of connectivity than others. In order to explore the relative importance of these actors to the social network, we characterise the response activities by using two social network metrics–sociometric status and centrality.
Sociometric status [15] is a measure of node activity that gives an indication of the contribution a given node makes to the overall amount of communication in the network. In developmental psychology, sociometric status reflects one’s popularity or rejection by peers.
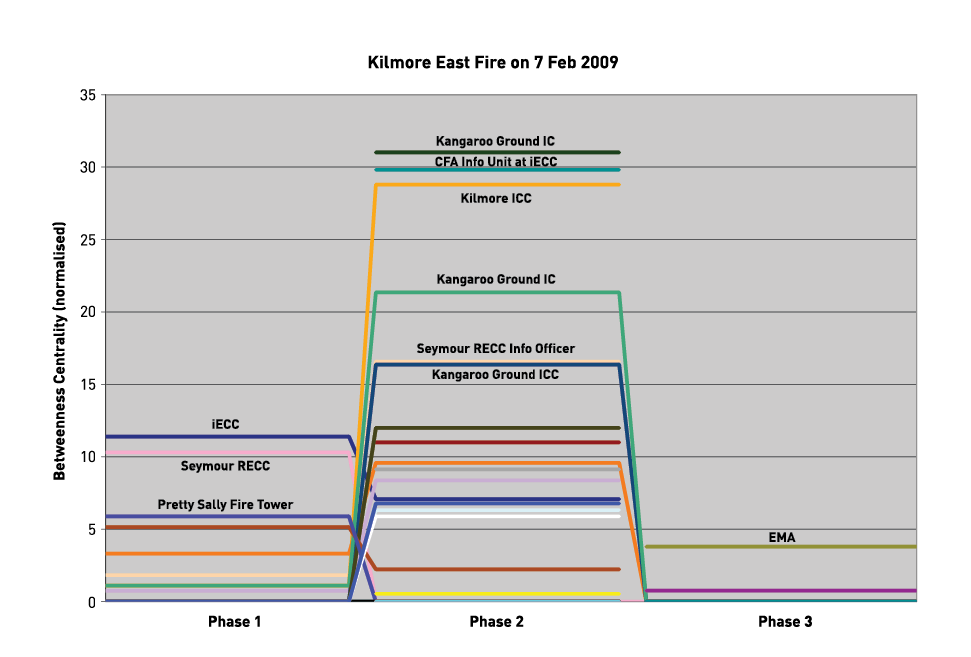
Centrality measures how well connected a node is in a social network. It denotes the structural power position of a node in a given network. Tapiero and Lewin [16] relate the concept of centrality to that of social importance, influence, and prominence of an actor. In particular, betweenness centrality is an overall indication of a node’s ability to act as a broker or conduit in the network. Betweenness is the number of times the node appears on the shortest path between pairs of other nodes. As an index of potential for control of communication, betweenness can reveal bottlenecks in communication and structural weak points to information flow. The higher the measure is, the more influence a particular node has on the entire network.
Figure 5 and Figure 6 show measures of sociometric status and betweenness for each phase, respectively. The value of the mean plus one standard deviation [17] is used to define key actors and labelled accordingly in the network. They were the integrated Emergency Coordination Centre (iECC) and the Seymour RECC (or its officers) in Phase 1; Kangaroo Ground actors, Country Fire Authority (CFA) Information Unit, and the Kilmore Incident Control Centre (ICC) in Phase 2; and the EMA in Phase 3.
Figure 5. Measures of sociometric status in Kilmore East Fire.
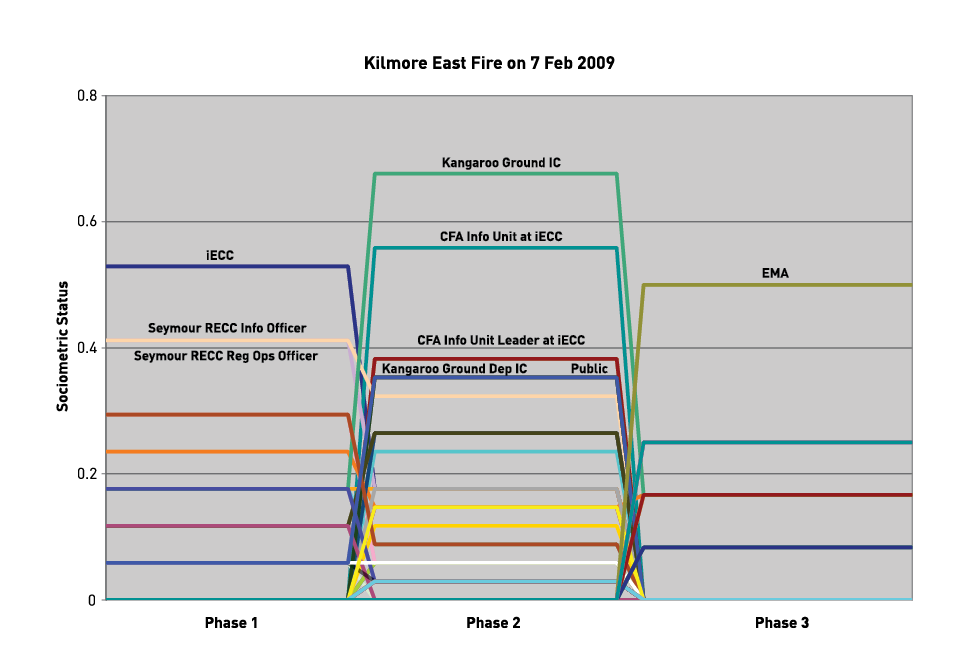
Figure 6. Measures of betweenness centrality in Kilmore East Fire.
In Figure 2, the social network in Phase 1 essentially comprises various separate components. After the initial report of a fire burning in Kilmore East from Pretty Sally fire tower, a command structure is developed into a main component with the iECC taking the central focus to coordinate activities amongst responding agents. However, other agents at the local level potentially affected by the incident are gaining awareness of the situation through their own clusters. An evolving cluster is centralised around Kangaroo Ground and fire tower operators, whereas some information exchanges between the Arthurs Creek and the Whittlesea CFAs broaden their awareness of the situation. Having loose clusters largely separated from the main component means that information for situational awareness does not reach the entire network. Isolated clusters are formed independently with no direct relationship between them, confusing initial responders’ understanding of the incident action plans.
From Figure 5, it is clear that three key actors are contributing significantly to the interactions of the network in Phase 1, i.e. the iECC, Seymour RECC Information Officer, and Seymour RECC Regional Operations Officer. From Figure 6, it can be seen that the iECC is also the most central agent within the social network in Phase 1, followed by the Seymour RECC and the Pretty Sally fire tower. Overall, the iECC is most central, exerting command and control through the Seymour RECC (and its actors) over the appointed agents within its command structure. This finding suggests that the emergency response network provides effective vertical command and control, yet the horizontal flow of information to other entities is ignored.
As incident intensity increases in Phase 2, the interaction between actors becomes more intense throughout the entire network. As shown in Figure 3, the network has a higher degree of connectivity than in Phase 1. The network structure is strengthened to form one main cluster.
In terms of sociometric status, Figure 5 shows that Kangaroo Ground Incident Controller has by far the highest status, followed by CFA Information Unit and its leader at the iECC, Kangaroo Ground Deputy Incident Controller, and the Public. Interestingly, the status of the agents at Kangaroo Ground suggests that during this phase of the incident, there are actually two networks, one focusing on incident command and control and the other on situational awareness. Kangaroo Ground Incident Controller (IC) and Deputy IC are two key agents in terms of centrality, reflecting their prominent communications roles in Phase 2 in terms of interactions with the regional actors for situational awareness.
In Phase 2, the Kilmore ICC has high centrality without a corresponding high value of sociometric status. Being assigned the controller of this incident, the Kilmore ICC and its actors should have played a prominent role in directing the incident response. As the information officer for the Kilmore East fire, Seymour RECC Information Officer has a high centrality score because of the continued role in collecting and disseminating information. This finding suggests a dysfunctional incident management team in which the Kilmore ICC does not sufficiently exercise its command and control leadership, while the function of information dissemination is left to the Seymour RECC.
In Phase 3, the EMA, and through its head DG EMA, lies at the hub of the network in Figure 4. The EMA needs to coordinate activities at the Commonwealth level amongst other actors to play a role in response to this incident. Actors at the local and regional levels are still involved and interacting to handle the situation. This is not to imply that the EMA fulfils a command role, but that it is the conduit through which agents (particularly Commonwealth actors) exchange information or communicate requests for information or action.
Figure 5 and Figure 6 clearly indicate that the EMA is the central focus of the social network, as it needs to coordinate activities amongst the greatest number of other agents. It is also the conduit through which agents within the network, exchange information or communicate requests for information or action. Nonetheless, this may be an incomplete finding because of the lack of detailed description of other emergency response activity in the Royal Commission reports.
Degree in social networks is used to measure connectedness, which defines the number of relationships or ties to which a particular node is connected. The social networks of the Kilmore East fire are directed graphs in which each node has both an in-degree and an out-degree, representing the numbers of incoming links and outgoing links, respectively. Effective response operations require collaboration between actors at all levels. Collaboration is defined as the act of working together to achieve collective results by sharing commitment among actors to the task at hand [18]. It is assumed that a collaborating node is the one who sends and receives information. Figure 7 compares in-degree against out-degree for all actors on Black Saturday. Out-degree measures the expansiveness and influence of an actor, whereas in-degree can be regarded as an indicator for the prominence or popularity of an actor. Information broadcasters are nodes in the bottom right region that have a high out-degree and a low in-degree (e.g., Seymour RECC Information Officer and CFA Information Unit at the iECC). Information receivers are nodes in the top left region that have a high in-degree and low out-degree (e.g., the Public).
Figure 7. Collaboration graph.
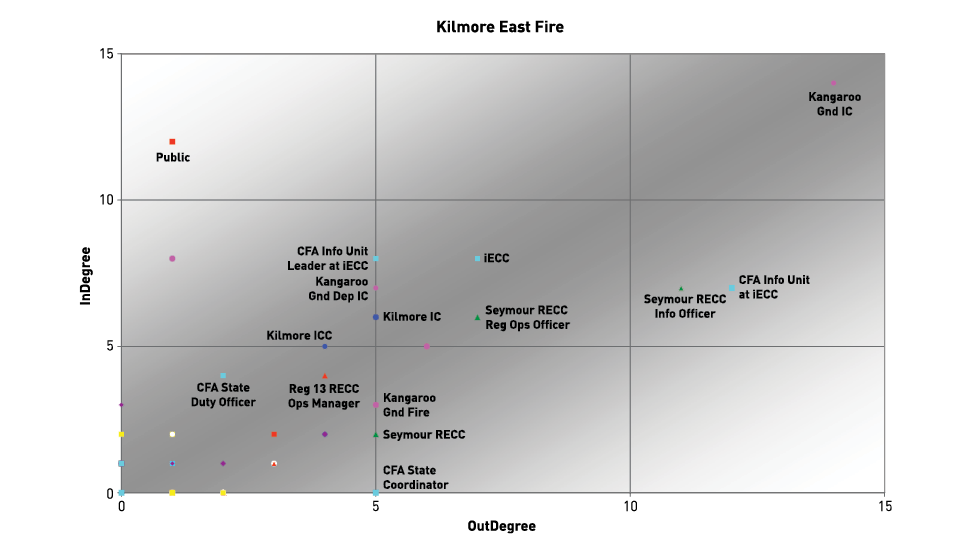
Along the upward diagonal, collaborators are those who have comparatively equal numbers of incoming and outgoing links [19]. These include Kilmore Incident Controller, Seymour RECC Regional Operations Officer, the iECC, and Kangaroo Ground Incident Controller. Note that the CFA and the Department of Sustainability and Environment (DSE) exercised their state-level coordination functions on 7 February from the iECC. The Seymour RECC was responsible for resource management and coordination in the region of the Kilmore East fire. The Kilmore ICC was the location where the Incident Controller was appointed to provide overall direction of the response to the fire. As Figure 7 demonstrates, the fact that Kilmore Incident Controller had minimal interaction with other actors suggests that the incident command system was ineffective, leaving the divisional commands to respond on their own initiatives. In contrast, Kangaroo Ground actors were assertive through their informal acquaintance networks in an effort to clarify command responsibilities even before the Kangaroo Ground ICC was assigned the divisional command near midnight.
An informed public is the best defence against any emergencies, during which demand for information is often overwhelming. In times of impending emergencies, the residents of the affected communities need to have situational awareness, in order to be able to make the right decision to stay or go. On Black Saturday, the fire agencies did attempt to communicate warnings to the public concerning the Kilmore East fire. Figure 8 illustrates the duration of the tasks in processing fire information release.
According to the interim report [9], four stakeholders at various levels of command originated the warning messages during Phases 1 and 2–the Seymour RECC, iECC, Kilmore ICC and Kangaroo Ground ICC. Initially, fire information release was processed through the Seymour RECC until an information officer was relocated to the Kilmore ICC in the late afternoon. However, multiple sources of emergency warnings may confuse the public and could lead to serious life-threatening consequences. These warning messages were provided to the ABC and local media agencies for radio broadcast and uploaded by CFA Information Unit onto the CFA websites. In Figure 8, warnings successfully released are coloured blue, whereas those failed to eventuate are in red. The existence of ineffectual efforts suggested that there was no credible mechanism for preparation and dissemination of warnings to the communities.
Figure 8. Duration of warning development concerning the Kilmore East fire.
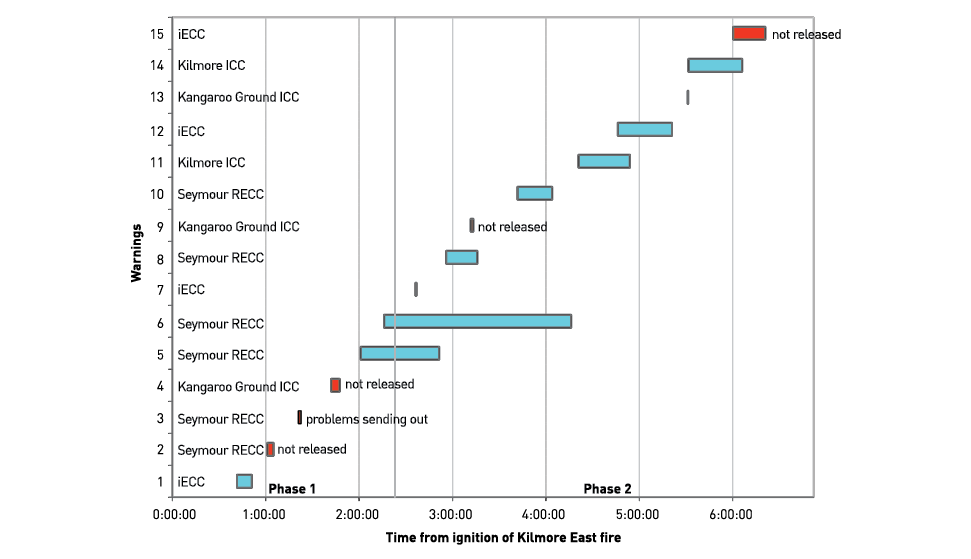
Overall, one message was issued within the first hour of the crisis, which was the only one during Phase 1 despite some attempts to convey more information to the communities. Whilst general warnings were issued prior to the Black Saturday, this lack of emphasis given to warnings at the early stage highlighted inadequate preparedness in the wake of a fire out of control. More frequent warnings were generated during Phase 2. However, the prolonged process to issue warning messages 5 and 6, in particular, was not considered normal practice to provide the public timely information about what was happening or what they needed to do to protect them.
This observation indicates that the public communication activities were poorly coordinated across the command and control units to respond to the deadly and intense firestorm in a timely fashion. Not only were the processing and dissemination of warning messages problematic, the content of the messages also failed to convey the severity and potential of the fire to the affected communities [9].
The inquiry revealed a number of systemic failures and leadership failures on Black Saturday [11]. The lack of pre-planning had significant effects on preparedness of emergency management officials and ultimately the ability to manage the fires. In particular, the Kilmore ICC was not ready for a hot start due to a lack of pre-positioned qualified staff and inadequate critical facilities. Failures of internal communication and breakdowns in warning development contributed to a lack of situational awareness and decision uncertainties among responders. The account of emergency response problems to the Kilmore East fire highlights a coordination issue most probably brought about by ineffective leadership and deficient communication infrastructure.
An incident command system is designed to ensure that decision making roles and responsibilities are assigned appropriately to the chain of command, while allowing for seamless integration of incident response activities and disparate resources of multiple agencies. Merely establishing an incident management team is insufficient to overcome an extreme disaster in a timely and efficient manner. Only fostering coordination of the teamwork enables the responders to work together to achieve the common goals. Coordination is an abstract concept that is difficult to measure, but network connectedness was found to be positively correlated with the potential for coordination [20]. Hence, a significant lack of interconnectedness and communication between actors has serious implications for coordination of emergency response in order to effectively manage interdependencies between activities. Further, it was found that coordination is strongly associated with network centrality of an individual, irrespective of the organisational position of that individual [21].
To determine who the key nodes were in the incident command system for the Kilmore East fire, this paper identified those in the top range for in- and out-degree, sociometric status, and betweenness centrality. These were actors in the iECC, the Seymour RECC, Kilmore ICC, Kangaroo Ground ICC, and the EMA. The first three entities were the leaders of the command hierarchy to empower and entrust responders to fulfil their roles in the emergency response effort. Although the Kilmore ICC was in charge of the crisis on Black Saturday, the facility was poorly equipped to operate at a heightened state of readiness in anticipation of the fire [9]. This serious shortcoming largely constrained the potential effectiveness of the incident command system. Besides, the proactive effort of the Kangaroo Ground ICC was unable to improve the extreme situation because of confusion about command.
Coordination is one of the critical issues confronting incident management. A command and control network for emergency response is meant to be distributed but integrated, underpinned by a high degree of coordination in dynamic situations. In this study, social network analysis provides a basis for examining the command and control arrangements on Black Saturday. The network visualisation illustrates the complex sequence of interactions from responders that allows for evaluation of the state of coordination. Communication brings an awareness of the situation and allows responders to make informed decisions about how to proceed in concert with others. Inadequate communication patterns however inhibit coordination and create misunderstandings between individuals. We inferred the state of coordination on Black Saturday from social network measures based on a positive correlation between network connectedness and the level of coordination [20,21].
The incident management team for controlling the Kilmore East fire can be seen to experience a real problem with managing effective coordination in times of crisis. Divided into three phases, the social network structure tended to follow the rhythm of the fire with the highest period of activity occurring in Phase 2. The inadequacies in coordination extended not only to the flow of information between actors but also to warnings and community advice. The warnings prepared for affected communities in the path of the Kilmore East fire were inadequate and failed to reflect the severity of the fire in a timely fashion. The arrangement of multiple initiators of warnings also negatively impacted on the effectiveness for communicating accurate information to the public and the consistency of the warnings.
Our study points to lack of efficiencies in network connectedness when the incident command system was called on for a real-life response effort. Operational coordination of an incident management team is as important as formal relationships defined by the organisational positions. If the connectedness of the command and control network is improved, the responders’ ability to coordinate should increase and, in consequence, a better outcome of the response operations.
Analysis of emergency response can enhance knowledge of the command and control arrangements and the patterns of communication, and expose the vulnerability of the network to systemic failures. Positive change is the bridge to the future. Lessons from the analysis results could be applied to the design of an adaptive and robust incident command system in order to gain the necessary synergies between the people, processes, and technology. Development of processes for incident management should be matched with qualified people responsible for responding to crises, while technology is considered the major enabler for spanning processes over functional and organisational boundaries.
B. Brehmer, “Dynamic Decision Making in Command and Control,” The Human in Command: Exploring the Modern Military Experience, McCann and Pigeau (Eds.), Kluwer Academic/Plenum Publishers, New York, 2000.
R. Wilcox, “A Systems Engineering Approach to Metrics Identification for Command and Control,”10th International Command and Control Research and Technology Symposium, Virginia Beach, VA, 2005.
B.T. Bakken, M. Gilljam, and T. Haerem, “Perception and Handling of Complex Problems in Dynamic Settings – Three Cases of Relevance to Military Command and Crisis Management,” in Conference of System Dynamics Society, 2004.
K.D. Kim and L. Hossain, “Emergency Preparedness Coordination: Network Approach in Dynamic Disaster Environments,” in Bridging the Socio-technical Gap in Decision Support Systems, A. Respicio et al. (Eds.), IOS Press, 2010.
E. van Borkulo, H.J. Scholten, S. Zlatanova, and A. van de Brink, “Decision Making in Response and Relief Phases,” in Geo-information for Disaster Management, Late Papers, P. van Oosterom, S. Zlatanova, and E.M. Fendel (Eds.), Delft, pp. 47-54, 2005.
C. Stewart, “Australia bushfires of 2009” Encyclopaedia Britannica Online. Accessed 17 Dec 2010 http://www.britannica.com/EBchecked/topic/1567897/Australia-bushfires-of-2009
G. Hughes, “Black Saturday fires had power of 1500 A-bombs,” The Australian Online. Accessed 07 Oct 2010 http://www.theaustralian.com.au/news/nation/black-saturday-fires-had-power-of-1500-a-bombs/story-e6frg6nf-1225714533980
“Responses to the Black Saturday bushfire crisis,” Wikipedia, the free encyclopaedia. Accessed 17 Dec 2010 http://en.wikipedia.org/wiki/Responses_to_the_Black_Saturday_bushfire_crisis
B. Teague, R. McLeod, and S. Pascoe, “2009 Victorian Bushfires Royal Commission Interim Report,” 2009 Victorian Bushfires Royal Commission, Parliament of Victoria, August 2009.
B. Teague, R. McLeod, and S. Pascoe, “2009 Victorian Bushfires Royal Commission Interim Report 2,” 2009 Victorian Bushfires Royal Commission, Parliament of Victoria, November 2009.
B. Teague, R. McLeod, and S. Pascoe, “2009 Victorian Bushfires Royal Commission Final Reports,” 2009 Victorian Bushfires Royal Commission, Parliament of Victoria, July 2010.
R.J. Houghton, C. Baber, M. Cowton, N. Stanton, and G. Walker, “WESTT (Workload, Error, Situational Awareness, Time and Teamwork): An Analytical Prototyping System for Command and Control,” Cognition Technology and Work, vol. 3, pp. 199-207, 2007.
T.A. Au, E.H.S. Lo, and P.J. Hoek, “Evaluation of Command and Control Activity for Air Operations,” Proceedings of the 45th Annual Conference of the Human Factors and Ergonomics Society of Australia, Melbourne, Nov. 2009.
V. Batagelj and A. Mrvar, “Pajek – Analysis and Visualisation of Large Networks,” in Graph Drawing Software, Mathematics and Visualisation, M. Jünger and P. Mutzel (eds), Berlin: Springer, 2003.
M.I. Benta, “Studying Communication Networks with AGNA 2.1,” Cognitie, Creier, Comportament / Cognition, Brain, Behavior [sic], vol. IX(3), pp. 567-574, September 2005.
C.S. Tapiero and A.Y. Lewin, “The Concept and Measurement of Centrality – An Information Approach,” Decision Sciences, vol. 4, no. 3, pp. 314-328, July 1973.
R.J. Houghton, C. Baber, R. McMaster, N.A. Stanton, P. Salmon, R. Steward, and G. Walker, “Command and Control in Emergency Services Operations: a Social Network Analysis,” Ergonomics, vol. 49, nos. 12-13, Oct 2006.
D. Pollard, “How to save the world,” Business Innovation & Knowledge Management, http://blogs.salon.com/0002007/2005/03/25.html
D.A. Jarvis, “A Methodology for Analysing Complex Military Command and Control (C2) Networks,” 10th International Command and Control Research and Technology Symposium, Virginia Beach, VA, 2005.
L. Hossain and M. Kuti, “CordNet: Toward a Distributed Behaviour Model for Emergency Response Coordination,” Project Management Journal, vol. 39, no. 4, pp. 68-94, Project Management Institute, Wiley InterScience, 2008.
L. Hossain and A. Wu, “Communications Network Centrality Correlates to Organisational Coordination,” International Journal of Project Management, vol. 27, pp. 795-811, Elsevier Ltd and IPMA, 2009.
Dr Andrew Au is a senior research scientist within the Joint Operations Division of Defence Science and Technology Organisation. His research work primarily focuses on modelling methodologies for socio-technical systems and the development of capabilities to support command and control. He is currently involved in examining command and control in the Air Operations Centre, and providing support to the national crisis coordination capability. He may be contacted on andrew.au@dstu.defence.gov.au