Abandoned vehicles can become obstacles for emergency services in the immediate aftermath of an earthquake (Ministry of Civil Defence & Emergency Management, 2009) and present logistical and environmental problems for the recovery process (Peterson, 2005; Foster, 2006). An estimated 2,800 vehicles were abandoned following the September 11, 2001, collapse of the World Trade Centre Towers in New York (Foster, 2006) and a total of 12,000 vehicles were abandoned following hurricanes Rita and Katrina (Department of Environmental Quality, 2007). People tend to travel by motor vehicle after earthquakes (Lamb & Walton, 2009), which creates a large volume of traffic that can overload the transport network (Mikami & Ikeda, 1985; Mileti & Nigg, 1984; Takuma, 1978; Walton & Lamb, 2009). Road blockages and damage to the road surface as a result of an earthquake will mean that some people may need to abandon their vehicle as they attempt to travel.
This study examines the likelihood of vehicle abandonment in response to a landslide that blocks the participant’s trip home in a simulated earthquake event. Computer-Aided Personal Interviewing (CAPI) was used to present the survey, which allowed for the multimedia presentation of the simulated earthquake and subsequent scenarios. Walton and Lamb (2009), and Lamb and Walton (2009) measured mode dependencies in relationship to trip distance, this study builds on those findings, also examining the normative influence of others.
In uncertain situations, individuals have been found to model their behaviours on others, referred to as informational influence (Baron, Vandello, & Brunsman, 1996; Deutsch, & Gerard, 1955; Kelly, 1952). While post-earthquake survey based studies, such as Borque, Russell, and Goltz (1993) have compared how responses differ depending on the presence or absence of others, this study examines social influence using an experimental methodology.
Distance is key factor in determining mode choice. Walton & Sunseri (2007) showed that under normal conditions 820 m is regarded as a reasonable walking distance for a specific purpose. After a simulated earthquake, people with access to motor vehicles were more likely to walk distances up to 3.25 km and were more likely to drive journeys over this threshold (Walton & Lamb, 2009). Given the importance of trip distance on mode choice, trip completion distance (distance from home when the landslide was encountered) was examined to ascertain whether distance influenced the likelihood of vehicle abandonment.
Lamb and Walton (2009) found that intended travel behaviours, measured using CAPI, were comparable to travel behaviours observed after the 2007 Gisborne earthquake in New Zealand. A similar link between intentions prior to disasters and actual behaviour was observed by Kang, Lindell and Pratter (2007). This study examines vehicle abandonment, across two independent measures: Trip completion distance and social influence. Three hypothesises were examined. First, a higher proportion of participants will choose to drive than walk. Second, social influence will increase the likelihood of participants choosing to abandon their vehicle when they encounter a landslide. Third, participants will be more likely to abandon their car if they are closer to their destination (75% trip complete) than further away (25% trip complete).
Two-hundred and twenty-one participants were recruited from Te Papa, New Zealand’s national museum, during a three-day exhibit on earthquake awareness. Members of the public were approached by experimenters and asked to participate in the study if they drove to Te Papa (to ensure that they had the opportunity to drive after the event). Participants were evenly represented across gender (100 males; 107 females; 14 did not respond to the question), χ2(1, N = 207) = .24, n.s., and reported a mean age of 37.9 years.
The survey contained thirty items and was presented via laptop computer (see Walton, Lamb & Dravitzki, 2007, for a description of CAPI methodology). The main measures included the participant’s home location, mode of travel on the day of the survey, vehicle type and ownership, as well as whether the participant was looking after children. The earthquake was depicted using a shaking image of the exterior of Te Papa accompanied by an audio sample of a rumbling earthquake. Participants were asked to imagine that they had decided to travel home. Participants estimated the distance from their current location to their home, the length of time it would normally take to make this trip, how long they would expect it to take after an earthquake, and the mode they would use to travel home. The actual distance in kilometres from Te Papa to the participant’s house via road was calculated using Google mapping software. A 5-point likert scale was used to measure seven items examining participant’s expectations of the trip, specifically; the suitability of their footwear for walking long distances and for walking through debris, their expectations of damage to roads and level of danger, likelihood of traffic jams, and judgements of the impact of their travel on others and whether driving after an earthquake was appropriate.
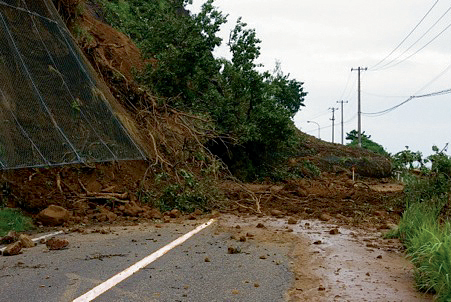
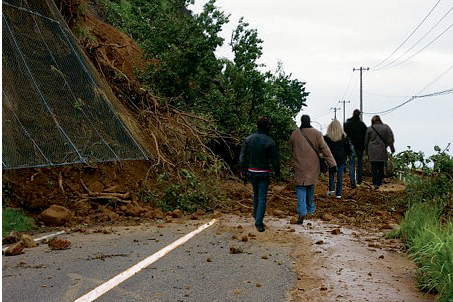
Participants who indicated they would walk home were given feedback on the accuracy of their estimation of the distance to their home, asked demographic questions and the survey was concluded. Participants who indicated they would drive home were randomly assigned to one of the four conditions across the two independent variables, social influence (social influence and no social influence) and trip completion distance (25% and 75% of the trip). Participants were presented with the landslide scenario and given feedback on their estimate compared with the actual distance to their home. The landslide scenario was depicted by one of two images of a road blocked by debris, shown in Figure 1. One image simply showed the landslide, the other was a manipulated version of the image that included people walking over it.
Figure 1. Images of landslide with and without social influence.
Control condition
Social influence condition
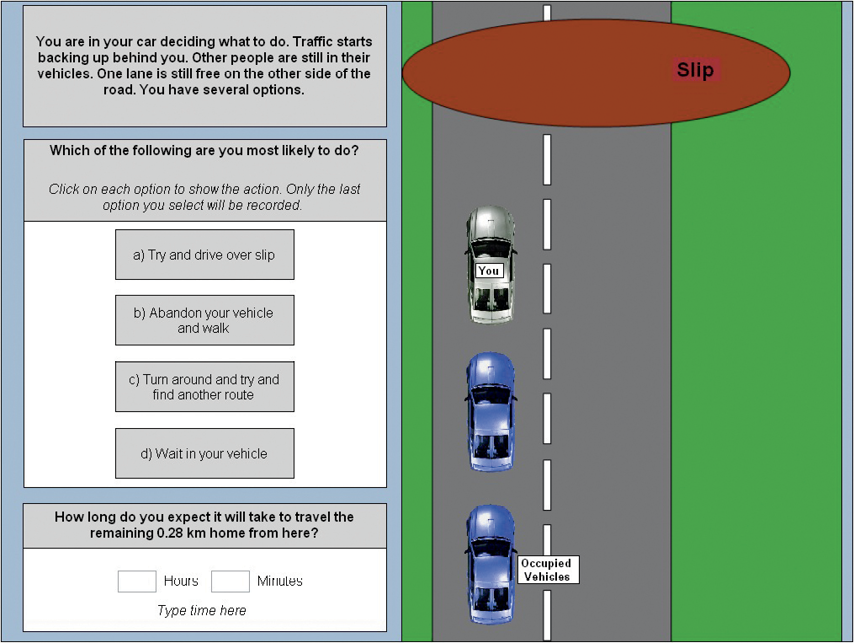
Participants were presented with four options; Try and drive over landslide, abandon your vehicle and walk, turn around and find another route, or wait in your vehicle. An interactive graphic illustrating the scenario was presented, shown in Figure 2. When each option was selected, a corresponding animation was triggered. The image in the social influence condition showed people walking over the slip, while no others were present in the control condition. Participants were then asked how long it would take to travel home from where they encountered the landslide.
Figure 2. Vehicle options for landslide with and without social influence.
Control condition
Social influence condition
Based on their response to the scenario, participants were presented with nine items on a 5-point Likert scale that examined their reasons for abandoning their vehicle, or their reasons for staying with their vehicle. All participants were asked to rate the realism of the landslide scenario on a 10-point continuous scale. The survey concluded with three demographic items; age, gender, and number of children.
Participants were seated at a laptop computer and asked to follow the on-screen instructions. The analysis was conducted with a 2x2 factorial design: Social influence (no influence / social influence), trip completed (25% / 75%). The analyses were conducted using independent samples t-tests, and two-way Chi-square contingency tables.
To ensure that the experimental manipulations were successful, several basic checks were carried out. First, it was necessary to ensure that the trip completion distance manipulation was effective. As expected, trip distances were significantly larger for the 25% trip completion condition (M = 12.33 km) than the 75% condition (M = 4.59 km), t (130) = 6.02, p < 001. Second, the distance, t (64) = -.13, n.s., and the social interaction, t (64) = .48, n.s., conditions were found to be independent, ensuring that changes observed across one condition could not be attributed to a change in the other. Third, it was necessary to establish that the landslide image manipulated to included people walking over the slip was equally believable as the unaltered image. As expected, no significant differences were observed between judgements of realism of the manipulated (M = 6.34) and unaltered images (M = 6.69), t (102) = .53, n.s.
In reaction to the simulated earthquake event, nearly two-thirds of participants chose to drive home (65.4%), and the remaining third chose to walk home (34.6%), χ2(1, N = 207) = 19.36, p < .001. Participants who chose to drive were significantly older (M = 40.3 years) than people who chose to walk (M = 35.0 years), Mann-Whitney U = 3182.0, p < .01, and also had significantly more children with them than people who chose to walk, Mann-Whitney U = 2877.0, p < .001. Participants from the Wellington region were significantly less likely to drive (60.2%) than people from other parts of New Zealand (87.2%), χ2(2, N = 205) = 10.12, p < .01. Vehicle type, χ2(4, N = 205) = 6.3, n.s., ownership of the vehicle χ2(3, N = 205) = 4.0, n.s., and gender, χ2(1, N = 205) = 1.2, n.s., all had no effect on the likelihood of walking or driving.
Participants who chose to walk home were significantly more likely to agree that driving was the ‘wrong’ way to travel (M = 89.9%), than people who chose to drive (M = 20.8%), Mann-Whitney U = 1056.5, p < .001. Further, participants who chose to walk were significantly more likely to agree that the way they chose to travel would not affect other peoples’ ability to travel (M = 31.9%) compared with people that chose to drive (M = 15.4%), Mann-Whitney U = 3287.0, p < .01.
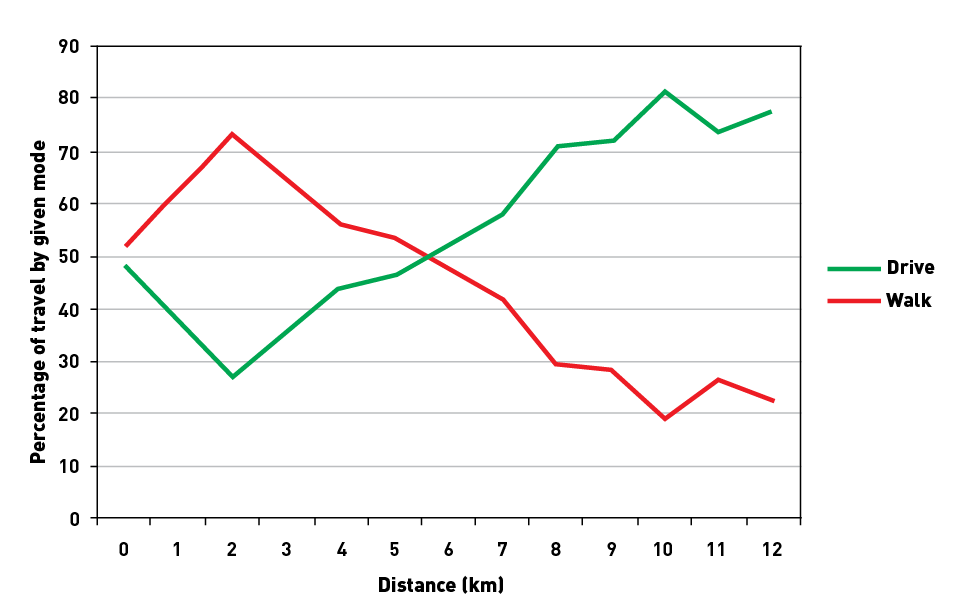
Overall, the likelihood of driving increased as trip distance increased, and the reverse relationship was observed for walking, presented in Figure 3. Walking was more likely up to a cut point of 6.25 km, after which driving became more likely. The crossover point was 46.1% of the average trip distance (M = 13.6 km, SD = 12.3). For trips that had a distance of less than 1 km, driving was more likely than walking. However, this is likely due to the very small sample size at that point (n = 4).
Figure 3. Likelihood of walking and driving across trip distance.
Social influence was found to significantly affect abandonment behaviour, χ2(3, N = 129) = 11.07, p < .05, shown in Table 1. Participants were 2.6 times more likely to abandon their vehicle and walk, than turn around find an alternative route when they observed other people walking over the landslide, compared with the control condition, Mantel-Haenszel (1, N = 103) = 4.07, p < .05 (95% CI from 1.1 to 5.9). When participants saw other people walking over the landslide, they were more likely to drive over the landslide, and with no social influence, they were more likely to turn around and find a way around the landslide.
Table 1. Driver abandonment behaviour across social influence condition.
| Social influence condition | ||||||
|---|---|---|---|---|---|---|
| Control | Social influence | Overall | ||||
| Behaviour | % | n | % | n | % | n |
| Try and drive over landslide | 1.4* | 1 | 11.9* | 7 | 6.2 | 8 |
| Abandon vehicle and walk | 42.9 | 30 | 55.9 | 33 | 48.8 | 63 |
| Turn around and find another route | 40.0* | 28 | 20.3* | 12 | 31.0 | 40 |
| Wait in vehicle | 15.7 | 11 | 11.9 | 7 | 14.0 | 18 |
| Total | 100 | 70 | 100 | 59 | 100 | 129 |
Participants who did not abandon their vehicle were more likely to judge that it would take too long for the landslide to be cleared when in the social influence condition (M = 2.62) than in the control condition (M = 1.88), t (64) = -2.76, p < .01. Participants who abandoned their vehicles were more likely to report that they would not be able to walk the distance home under no social influence (M = 4.24) than those in the social influence condition (M = 3.81), t (59) = 2.2, p < .05.
Abandonment behaviour across distance from home is shown in Table 2. The distance from home (25% vs. 75%) had no effect on the four options presented at the landslide, χ2(3, N = 129) = 3.0, n.s. When the four options were collapsed into abandon vehicle and stay with vehicle, no effect was observed across distance home, χ2(3, N = 129) = 3.04, n.s.
Table 2. Abandonment behaviour across distance from home.
| Percentage of trip complete | ||||
|---|---|---|---|---|
| 25% | 75% | |||
| Behaviour | % | n | % | n |
| Try and drive over landslide | 3.1 | 2 | 9.2 | 6 |
| Abandon vehicle and walk | 46.9 | 30 | 50.8 | 33 |
| Turn around and find another route | 35.9 | 23 | 26.2 | 17 |
| Wait in vehicle | 14.1 | 9 | 13.8 | 9 |
| Total | 100.0 | 64 | 100.0 | 65 |
This study used an experimental methodology to examine individuals’ likely vehicle abandonment behaviours during post-earthquake travel on a disrupted transport network. People have been found to over rely on private motor vehicles for transport after both simulated (Walton & Lamb, 2009) and real earthquake events (Lamb & Walton, 2009; Mikami & Ikeda, 1985; Mileti & Nigg, 1984; Takuma, 1978). Our research supports these findings, as motor vehicle was the primary mode choice after the simulated earthquake (65.4%) followed by walking (33%), supporting hypothesis one.
Walking was more likely for distances up to 6.25 km, after which driving became more likely, compared with a threshold of 3.25 km, found by Walton and Lamb (2009). However, the cut-point as a proportion of mean trip distance, was comparable for both studies; 46.1% for this study and 37.4% for Walton and Lamb (2009). This accounts for the longer average trip distances in this study, as the exhibition drew people from greater distances than the normal weekday travel examined Walton and Lamb (2009). The similarity of these proportions indicates that that there is a relationship between average trip distance and the threshold walking distance.
Mode choice was also influenced by demographic factors. Individuals with children may have been more likely to drive because children are less able to walk long distances. Alternatively, parents may believe their children would be safer travelling by motor vehicle. The increased likelihood of driving for those who live outside the region is unclear. It is possible that they have a greater attachment to their vehicle because they need it to be able to travel home, whereas locals are relatively less reliant on vehicles. Respondents who drove were less aware that they are contributing to a potential overload of the transport network than those who chose to walk. Whether the choice to drive reflects a lack of understanding of the effects of their behaviours, or a deliberate decision to travel in despite the consequences for others, is unclear.
Behaviour in disasters has been shown to be rational (Mileti and Nigg, 1984; Quarantelli and Dynes, 1976; Ramachandran, 1990), although it is typically self-interested (Lamb & Walton, 2009; Walton & Lamb, 2009). Upon encountering the landslide, participants were most likely to abandon their vehicle and continue on foot (49%) followed by turning their vehicle around and attempting to find an alternative route (31%). This indicates that 32% of drivers adopted a strategy of minimising potential walking distance by driving as far as possible before abandoning their vehicle to walk, which contributes to congestion and increases the number of vehicles likely to be abandoned.
In ambiguous situations, or where individuals are unlikely to have previous experience, they tend to model their behaviour on others, referred to as informational influence (Deutsch, & Gerard, 1955; Kelly, 1952). In this study, when participants observed other people abandoning their vehicles and walking, they were 2.6 times more likely to mimic this behaviour than to stay in their vehicle and find an alternative route, supporting hypothesis two. Social influence affected not only their intended behaviour, but also their perception of the situation, such as judgements of walkable distances and landslide clearance times.
Distance from home did not affect abandonment behaviour, therefore hypothesis three was not supported. It may be that participants believed walking was inevitable because of the potential damage to the road network. Alternatively, people may be poor at judging distance, and distance does indeed have an effect on abandonment but this study failed to measure it.
While behavioural intentions has been shown to be a valid method of examining response behaviours in disaster scenarios (Kang, Lindell & Pratter, 2007; Lamb & Walton, 2009) these findings need to be compared to patterns of vehicle abandonment after an actual event. Given that distance had an effect on mode choice, it seems unlikely that distance from home would have no effect on the likelihood of abandonment. The distance manipulation might have been more effective if the distance from home was illustrated on a map to provide a more understandable context. Future studies could further investigate factors that influence abandonment, and examine the effectiveness of official advice to avoid travel and advance warning of damage to the network on the likelihood of choosing to drive.
The overreliance on motor vehicles in earthquake events poses a key problem for emergency managers. A third of drivers attempted to drive as far as they can before they abandon their car and walk. This rational, but self-interested behaviour is characteristic of travel behaviour immediately after an earthquake. Observing other people abandoning their vehicles increased the likelihood of participants choosing to abandon their vehicles. It is theorised that this is because people are unsure what they should do in these situations and model their behaviours on those they observe.
This research was funded by the Foundation for Science, Research and Technology (OPSX0002), New Zealand. The authors wish to acknowledge Kate Smith, Josh Spelchan, Stephen Murray, Sarah Bowler and Lauren Christie.
Baron, R. S., Vandello, J. A., & Brunsman, B. (1996). The forgotten variable in conformity research: Impact of task importance on social influence. Journal of Personality and Social Psychology, 71, 915-927.
Borque, L.B., Russell, L., & Goltz, J. (1993). Human behaviour during the and immediately after the earthquake. In P. Bolton (Ed.), The Loma Prieta, California, earthquake of October 17, 1989: Societal response (Vol. 1553-B, 3-22). Washington Denver, CO: US Geological Survey professional paper.
Department of Environmental Quality. (2007). Progress and Disposal of Vehicles and Vessels. Louisiana Legislative Auditor, Department of Environmental Quality, 1-18.
Deutsch, M. & Gerard, H. B. (1955). A study of normative and informational social influences upon individual judgement. Journal of Abnormal and Social Psychology, 51, 629-636.
Foster, M. (2006). Damaged cars litter Katrina landscape. Deseret News (Salt Lake City), March 24, 2006. Retrieved 25/1/09 from: http://findarticles.com/p/articles/mi_qn4188/is_20060324/ai_n16167156 accessed 29-01-09.
Hays, W. L. (1994). Statistics. Forth Worth: Harcourt Brace College Publishers
Kang, J.E., Lindell, M.K., & Pratter, C.S. (2007). Hurricane evacuation expectations and actual behaviour in Hurricane Lili. Journal of Applied and Social Psychology, 37, 887-903.
Kelly, H. H. (1952). Two functions of reference groups, in G.E. Swanson, T.M. Newcomb & E.L. Hartley (eds), Readings in Social Psychology (2nd ed, 410-414). New York: Holt, Rinehart & Winston.
Lamb, S. & Walton, D. (2009). Travel behaviours following the 2007 Gisborne earthquake: Evidence for the use of simulation in earthquake research. International Journal of Emergency Management, Manuscript submitted for publication.
Mikami, S. & Ikeda, K. (1985). Human response to disasters. International Journal of Mass Emergencies and Disasters, 3, 107-132.
Mileti, D.S. & Nigg, N.M. (1984). Earthquake and Human Behaviour. Earthquake Spectra, 1, 89-106.
New Zealand Ministry of Civil Defence and Emergency Management (2009). What to do in an earthquake. Retrieved Jan 29th, from http://www.getthru.govt.nz/web/GetThru.nsf/web/BOWN-7GY5TP?OpenDocument
Peterson, M. (2005). New Orleans’ Waste Woes (transcript). Living on Earth, retrieved 10/1/09, from http://www.loe.org/shows/shows.htm?programID=05-P13-00048#feature5 accessed 29-01-09
Quarantelli, E.L. and Dynes, R.R. (1976). Community conflict: its absence and its presence in natural disasters. Mass Emergencies, 1, 139–152.
Ramachandran, G. (1990). Human behaviour in fires – A review of research in the United Kingdom. Fire Technology, May, 149-155.
Takuma, T. (1978). Human behaviour in the event of earthquakes. In, Quarantelli, E.L. (Ed.), Disaster Theory and Research. Sage Publications Ltd. London, Beverly Hills. International Sociological Association (USA).
Walton, D. & Lamb, S. (2009). An experimental investigation of post-earthquake travel behaviours: The effects of severity and initial location. International Journal of Emergency Management, 6 (1), 14-32.
Walton D., Lamb, S. & Dravitzki, V.K. (2007). An experimental investigation of the influence of media type on individual perceptions of the severity of earthquake events. International Journal of Emergency Management, 4, 630-648.
Walton, D. & Sunseri, S. (2007). Impediments to Walking as a Mode Choice. Land Transport New Zealand Research Report 329, 1-46.
Steve Lamb is completing a PhD through the University of Western Sydney. He may be contacted at Email: stevelamb5150@gmail.com.
Darren Walton is the Director, Research and Evaluation Unit at the Health Sponsorship Council (HSC) in New Zealand. He is also a Senior Adjunct Fellow at The University of Canterbury. He may be contacted at Email: darren@hsc.org.nz.
This research was conducted within a programme of public good research funded by the Foundation for Science, Research and Technology (OPSX0002), New Zealand.