Using Manly, Sydney as a case study, Dall’Osso and Dominey-Howes explore the implications for enhancing tsunami risk management based upon high-resolution assessments of building vulnerability.
Australia is at risk from tsunamis and recent work has identified the need for detailed models to assess the vulnerability of buildings to damage during tsunamis. Such models will be useful for underpinning the development of land-use zoning regulations, the identification of appropriate design standards and construction codes and in outlining community relevant tsunami disaster risk reduction strategies by local emergency managers. Such strategies might include the identification of coastal areas that require evacuation, the identification of specific buildings that might be the focus of search and rescue efforts, and the demarcation of ‘safe’ evacuation areas and structures within expected tsunami flood zones. We use the results of a very high-resolution assessment of building vulnerability to tsunami (using the PTVA-3 Model) at Manly, Sydney to illustrate how vulnerability assessments could be used to enhance tsunami risk reduction.
The coasts of Australia are at risk from tsunamis. Dominey-Howes (2007) indicates that more than 40 tsunamis have affected Australia since 1788. The 2004 Indian Ocean and 2006 Java tsunamis both resulted in flooding of low-lying coastal areas of NW Western Australia. More recently, the 2007 Solomon Islands and 2009 New Zealand tsunamis were both recorded on tide gauges along the eastern seaboard of Australia although there was no significant inundation associated with these events.
For the coast of New South Wales (NSW) (Figure 1a), tide-gauge records show that historically, only small tsunamis have occurred (Dominey-Howes, 2007). Reported geological evidence however, suggests that megatsunami many times larger than the 2004 Indian Ocean event may have occurred many times during the last 10,000 years – a period in earth history called the Holocene (for original references, see the reviews of Dominey-Howes, 2007 and Dominey-Howes et al., 2006). This geological work has led to the development of what has been referred to as the ‘Australian Megatsunami Hypothesis’ or ‘AMH’ (Goff et al., 2003; Dominey-Howes et al., 2006). The evidence for the ‘AMH’ is very controversial (Felton and Crook, 2003; Goff and McFadgen, 2003; Goff et al., 2003; Noormets et al., 2004). First, some of the proposed evidence for megatsunami has clearly been incorrectly interpreted (Dominey-Howes et al., 2006). Second, there appears to be a ‘disjunct’ or mismatch between the historic record of small frequent events and the Holocene record of large infrequent tsunami (Dominey-Howes, 2007; Goff and Dominey-Howes, 2010). Last, no independent verification of the sources of these events has been undertaken—a vital component for understanding risk (Dawson, 1999). Bryant (2008) however, advocates a cosmogenic source for these events although this hypothesis also remains to be proven.
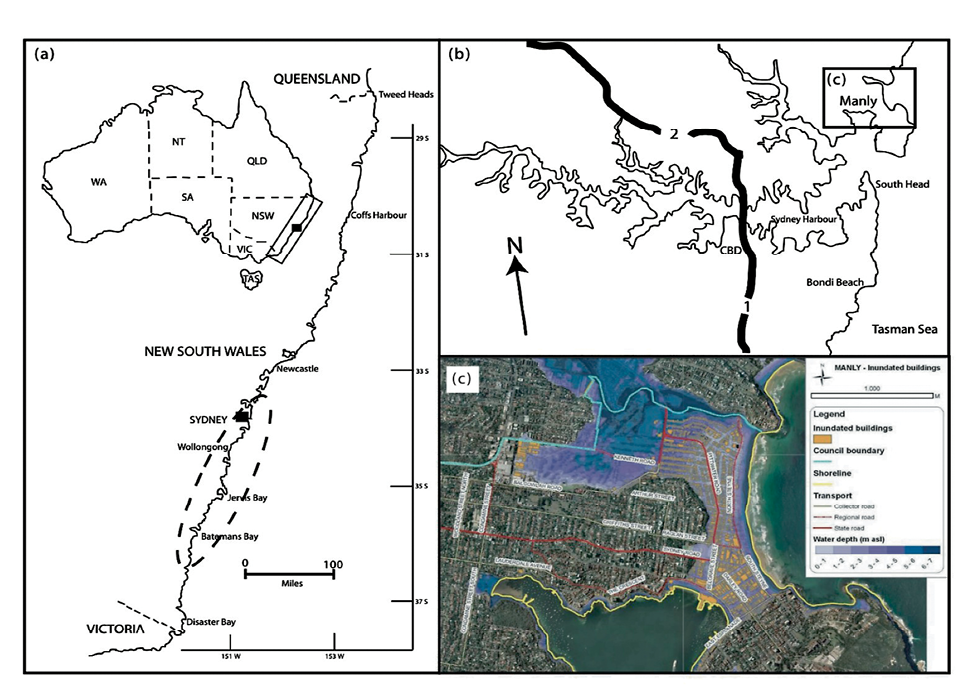
Figure 1. (a) Broad location of the study region of Sydney located in New South Wales, SE Australia. The hatched oval encompassing the region north of Sydney south to beyond Batemans Bay is the region reported to have been affected by Holocene megatsunamis. NSW = New South Wales, NT = Northern Territory, SA = South Australia, TAS = Tasmania, VIC = Victoria, WA = Western Australia.
(b) Simplified map of the Sydney Harbour region with Manly located NE of the CBD. Highways 1 and 2 are shown.
(c) Detailed GIS map of Manly. Area of inundation (including relative water depths above land surface) associated with the tsunami referred to are shown in blue. Principal features are highlighted and buildings inundated by the tsunami are indicated in orange.
If the ‘AMH’ can be independently validated, it has profound implications for the coastal vulnerability of NSW and government agencies (such as the NSW State Emergency Service (NSW SES)) are very likely and understandably, completely unprepared for such events. Further, it indicates that we should not be complacent about the potential magnitude of future tsunamis even though only small events have occurred in the past. For example, the proposed Holocene megatsunami occurred in coastal areas of NSW where more than 330,000 people now live within 1 km of the coastline and at no more than +10 metres above sea level (m asl) (Bird and Dominey-Howes, 2006; 2008). More than 20% of these people are over the age of 65 (Opper and Gissing, 2005). Furthermore, within the Sydney region, approximately 400,000 property addresses are located less than 3 km from the coast and about 200,000 are less than +15 m asl (Chen and McAneney, 2006). These properties have a combined value of more than $150 billion. Given this massive exposure, it is of concern that our understanding of the regional tsunami risk remains limited and unverified and that no work has been undertaken to assess the ‘vulnerability’ of coastal buildings.
Hall et al., (2008) outlined an extremely useful ‘step-by-step scientific process’ to gather information useful for assessing the risk to Australia’s coasts from tsunamis. The first part of this process defines all likely sources of tsunamis, estimates their frequencies and then propagates tsunami waves from these sources to shallow water adjacent to the coast providing a probabilistic wave height for any particular return period of interest. The second step of the process utilises inundation modelling to examine exactly how far inland and to what elevation above normal sea level a particular tsunami might flood. At the present time, in Australia, Geoscience Australia is the agency that undertakes these tasks.
The final step in the scientific process described by Hall et al., (2008) is to map the ‘exposure’ of (for example) buildings within the expected inundation zone and then assess the ‘vulnerability’ of those structures to damage associated with that event. So far though, this last step has not been undertaken by any official government agency or emergency service.
Only one model has been developed that assesses the vulnerability of buildings to damage from tsunamis. This model – the Papathoma Tsunami Vulnerability Assessment (or PTVA) Model has been described in detail in Papathoma et al., (2003) and Papathoma and Dominey-Howes (2003). It was then validated by Dominey-Howes and Papathoma-Köhle (2007) and Dall’Osso et al., (2010) and applied to different case studies by Papathoma et al., (2003), Papathoma and Dominey-Howes (2003) and Dominey-Howes et al., (2010). Broadly speaking the model collects and integrates engineering attributes about buildings together with information about the tsunami and the natural environment in order to calculate a ‘Relative Vulnerability Index’ (RVI) score or rank for each building.
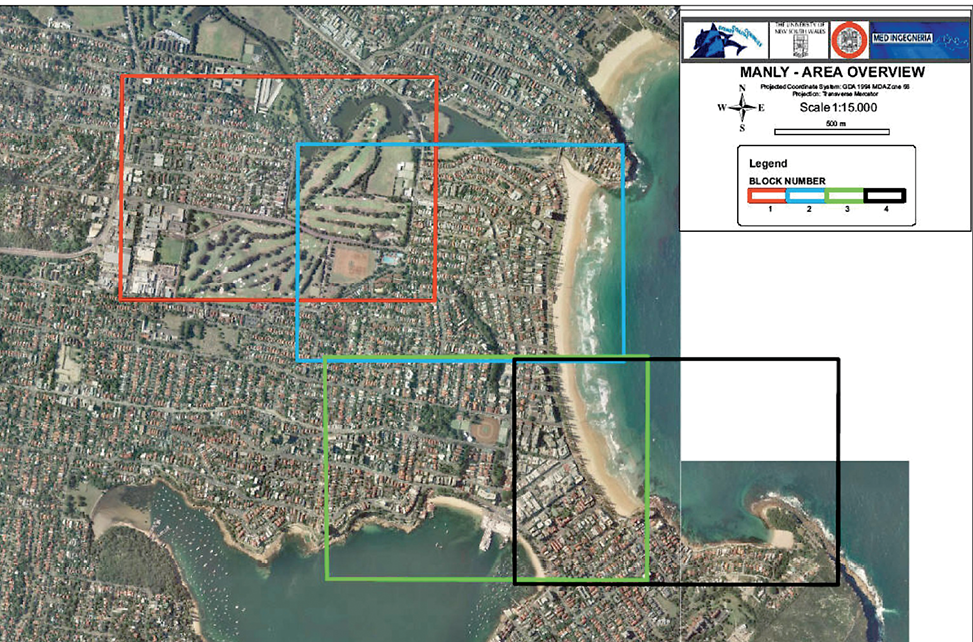
Recently, Dall’Osso et al., (2009a) presented a newly revised and improved version of the model – PTVA-3. Further, Dall’Osso et al., (2009b) applied the PTVA-3 model to a case study in Manly, Sydney (Figure 1b, c). They undertook an assessment of 1100+ individual buildings located within the expected flood zone associated with a particular tsunami scenario. The scenario is fully described in Dall’Osso et al., (2009b) and the area of Manly forecast to be inundated is shown in Figure 1c. Since the area inundated was large, they presented their assessment of building vulnerability in four separate blocks (referred to as ‘Manly, Block 1 to 4) (Figure 2).
Figure 2. The Manly study area divided in to four (4) ‘Blocks’ for ease of results presentation. This paper just deals with Blocks 2 and 3.
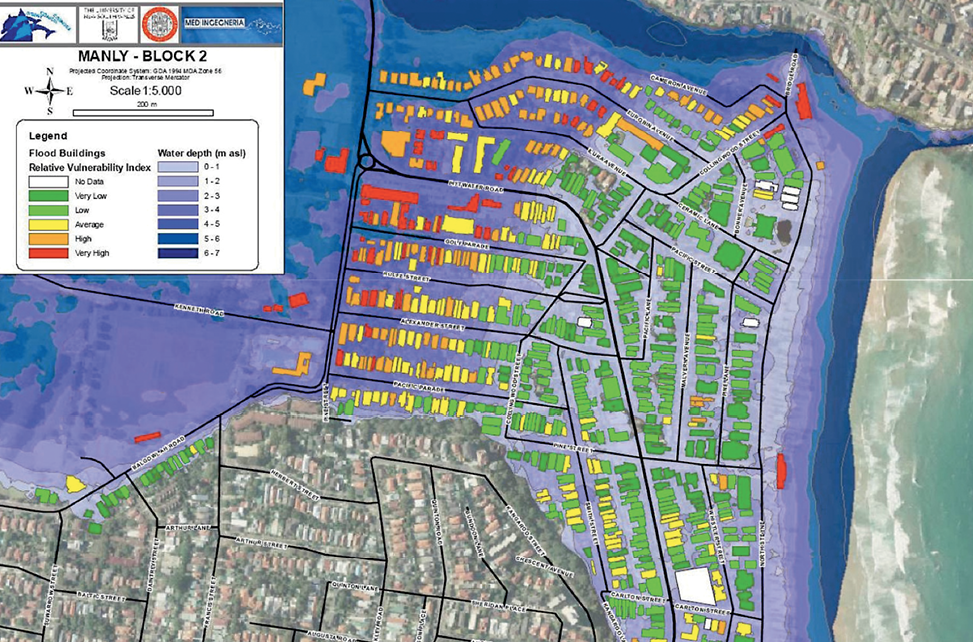
For a full description of the results of the case study, see Dall’Osso et al., (2009b). However, their main findings are shown in Table 1. They divided the buildings in to nine classes and assessed the RVI scores of each building in each class. Table 1 indicates that of the 1100+ buildings they assessed, the majority of the building stock is residential followed by commercial. The absolute number of buildings in each class assessed as having a particular RVI score are indicated in columns 3 to 7 of Table 1. An example of the spatial distribution of all buildings in Block 2 of different classes, together with their RVI scores is shown in Figure 3. It is clear therefore, that the application of the PTVA-3 Model to individual buildings located within an expected inundation zone can provide very high-resolution information about the spatial vulnerability of buildings and by analogy, the population in that area.
Figure 3. Tsunami inundation and water depth in Block 2, Manly. The RVI scores of every building of all classes located within the inundation zone are indicated.
Many different stakeholders will be interested in the management of risk associated with tsunamis. However, here we focus on Australian Local Government Authorities (LGA’s) (including their Local Emergency Management Officers (LEMO’s)) together with their local units of the State Emergency Service (SES) who are at the sharp end of dealing with hazardous events such as tsunamis.
Local government planners will be interested in a number of questions that include (but are not limited to):
Local Government LEMO’s and Emergency Service personnel will be interested in (amongst others) questions such as:
We are not qualified to address these questions but it is clear that the approach we have developed and tested and which is detailed in Dall’Osso et al., (2009a, b) does provide the sort of high-resolution data needed by decision makers to tackle these important questions.
Maps displaying ‘exposure’ during inundation such as Figures 1c and 3, will be useful for guiding decision making processes related to land-use zoning. It is apparent that having accurate information about flow depth above ground surface will be useful for those organisations who make decisions about development proposals, building design and regulation. We are aware that prohibiting development of coastal landscape areas is neither desirable or in many cases, practical. However, data generated by models and approaches like ours certainly can help to guide decision making to ensure new, and re- developed, structures are constructed to a standard that reduces risk to an affordable minimum.
Some of the individual buildings located in Block 2 (Figure 3) are directly owned and managed by the Manly LGA. Table 1 indicates that some seven (7) LGA buildings in the whole Manly area that would be affected by a tsunami are assessed as having “High” or “Very High” RVI scores. In many ways, local taxes and environmental levies paid by residents in this LGA are used (in part) for the upkeep of buildings owned and managed by the authority. Therefore, the LGA might use the results of an assessment like that described by Dall’Osso et al., (2009b) to prioritise actions that help to reduce the vulnerability of these buildings and enhance the capacity of the LGA to recover after a tsunami event. Once again, we are not making recommendations but are pointing towards where, and how, our work might assist local decision makers.
We have used some of the results generated by Dall’Osso et al., (2009b) to explore the potential identification of areas that might be classified as ‘safe evacuation areas’ during a tsunami. Figures 4 and 5 display those areas we think could be the subject of evacuation orders. Where appropriate, in each area, we have identified individual buildings that could be used for vertical evacuation above the maximum expected flood level. In Figures 4 and 5, these individual buildings are coloured green. These buildings are identified from the PTVA-3 Model analysis carried out by Dall’Osso et al., (2009b) because they have the lowest RVI values and because their upper floors lie well above the expected maximum flood height. That is, these buildings have at least two floors above the expected maximum flood level. Once again, it should be noted that we are not making recommendations that these specific buildings should be designated ‘safe evacuation structures’, merely that such analysis can lead to the identification of such buildings. It is for others to determine which are most suitable.
Figure 4. Evacuation areas and ‘safe’ buildings for evacuation, Block 2, Manly.
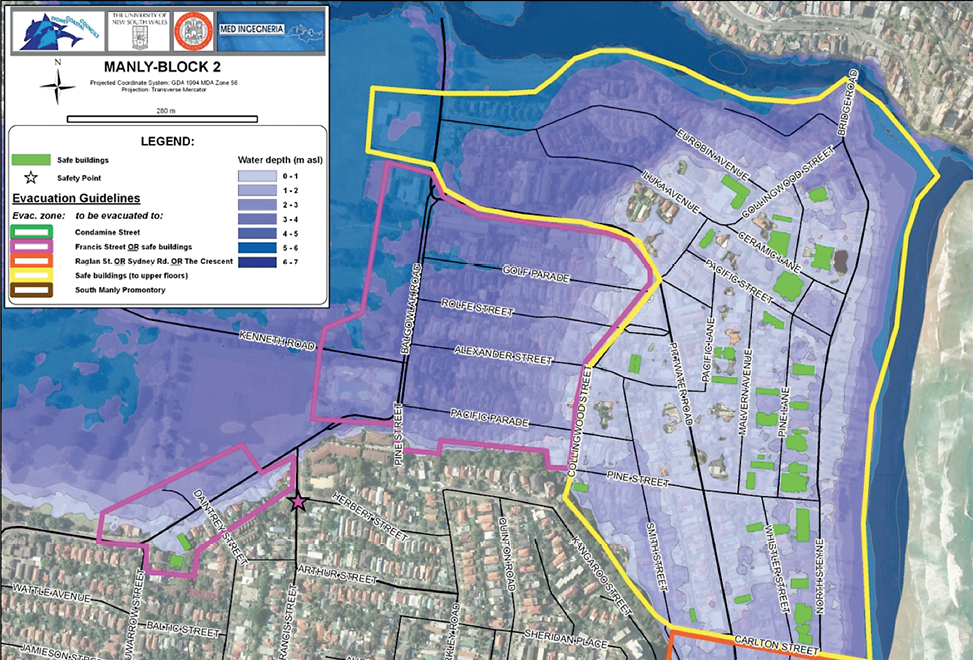
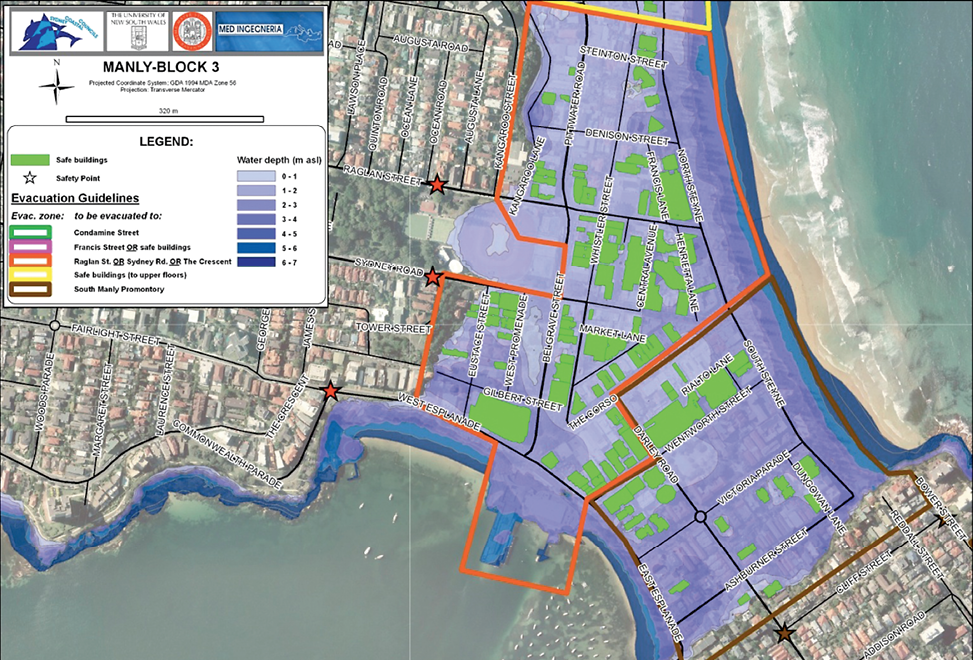
Figure 5. Evacuation areas and ‘safe’ buildings for evacuation, Block 3, Manly.
The type of work carried out by Dall’Osso et al., (2009b) is extremely valuable. For example, Figure 4 shows that the recommended ‘evacuation area’ that bounds Golf Parade, Rolfe Street, Alexander Street, Pacific Parade and Pine Street does not contain a single building that would be ‘safe’ to evacuate in to during a tsunami associated with their scenario. That is, all buildings would be almost fully inundated and many would be severely damaged, if not completely destroyed. Therefore, people that occupy these buildings would need to fully evacuate the whole area. Having information like this means that the Emergency Services can pre-plan the best evacuation routes, implement signage at street level and develop and engage in community education and outreach programs. The value of such ‘draft’ evacuation maps has recently been presented and discussed in Dall’Osso and Dominey-Howes (2010). Conversely, the large evacuation area of Figure 4 parallel with the coast has many individual buildings we assess as useful for vertical evacuation (although the western ends of Eurobin Avenue and Iluka Avenue are some what problematic).
Figure 5 shows the mixed residential and commercial area of Manly CBD. Although the flow depth above ground surface is rather high in the tsunami scenario examined in this case, many individual buildings are assessed as being appropriate for vertical evacuation. Given that the ocean beach at Manly is a favourite with beach going visitors to the area and can be heavily populated on a sunny weekend in the summer, the close proximity of many buildings suitable for vertical evacuation, is somewhat reassuring.
As our cities expand, the exposure of our built environment to hazards such as tsunamis increases. Australia is at risk to tsunamis. The 2004 Indian Ocean tsunami was catastrophic. In some areas like Banda Aceh city, near complete devastation of the urban landscape occurred. Abandoning coastal regions affected by hazards such as tsunamis is simply not possible for a variety of reasons. Therefore, in order to enhance tsunami risk reduction strategies, high-resolution assessments of building vulnerability are required. Such assessments provide the building blocks upon which appropriate risk reduction strategies may be formulated. Recent work by Dall’Osso et al., (2009a, b) using a newly revised and improved PTVA-3 Model has been shown to be useful for providing very high-resolution assessments of the vulnerability of individual building structures to tsunamis of particular magnitudes. In this paper, we have taken the outputs from Dall’Osso et al., (2009b) and shown where and how they may be used to address important questions of relevance to local government and emergency services officers. We use a detailed case study from Manly, Sydney to explore these questions and options. We have not made specific recommendations since in our view, it is the role of responsible professional decision makers to best decide how such data might be used.
We would like to thank Geoff Withycombe of the Sydney Coastal Councils Group Inc. for his considerable efforts in helping to organise contact with Sydney local government authorities. We thank Manly Local Government for access to data used in the modelling undertaken in this study. James Goff at the Australian Tsunami Research Centre, UNSW is thanked for helpful discussion about ideas expressed herein.
Bird, D. & Dominey-Howes, D. (2008). Testing the use of a ‘questionnaire survey instrument’ to investigate public perceptions of tsunami hazard and risk in Sydney, Australia. Natural Hazards, 45, 99-122.
Bird, D. & Dominey-Howes, D. (2006). Tsunami risk mitigation and the issue of public awareness. The Australian Journal of Emergency Management, 21 (4), 29-35.
Bryant, E. (2008). Tsunami: The underrated hazard (2nd ed.): Chichester, Springer Praxis Publishing, 342 pp.
Chen, K. & McAneney, J. (2006). High-resolution estimates of Australia’s coastal population. Geophys Res Lett 33, doi:10.1029/2006GL026981.
Dall’Osso, F. & Dominey-Howes, D. (2010). Public assessment of the usefulness of “draft” tsunami evacuation maps from Sydney, Australia – implications for the establishment of formal evacuation plans. Natural Hazards and Earth System Sciences, 10, 1-12.
Dall’Osso, F., Gonella, M., Gabbianelli, G., Withycombe, G. & Dominey-Howes, D. (2009a). A revised (PTVA) model for assessing the vulnerability of buildings to tsunami damage. Natural Hazards and Earth System Sciences, 9, 1557-1565.
Dall’Osso, F., Gonella, M., Gabbianelli, G., Withycombe, G. & Dominey-Howes, D. (2009b). The vulnerability of buildings to tsunami in Sydney. Natural Hazards and Earth System Sciences, 9, 2015-2026.
Dall’Osso. F., Maramai, A., Graziani, L., Brizuela, B., Cavalletti, A., Gonella, M. & Tinti, S. (2010). Applying and validating the PTVA-3 Model at the Aeolian Islands, Italy: assessment of the vulnerability of buildings to tsunamis. Natural Hazards and Earth System Sciences, 10, 1547-1562.
Dawson, A. (1999). Linking tsunami deposits, submarine slides and offshore earthquakes. Quaternary International, 60 (1), 119-126.
Dominey-Howes, D. & Papathoma, M. (2007). Validating a Tsunami Vulnerability Assessment Model (the PTVA Model) Using Field Data from the 2004 Indian Ocean Tsunami. Natural Hazards, 40, 113-136.
Dominey-Howes, D. (2007). Geological and historical records of Australian tsunami. Marine Geology, 239, 99-123.
Dominey-Howes, D., Dunbar, P., Vernar, J. & Papathoma-Köhle, M. (2010). Estimating probable maximum loss from a Cascadia tsunami. Natural Hazards, 53, 43-61.
Dominey-Howes, D., Humphreys, G. & Hesse, P. (2006). Tsunami and palaeotsunami depositional signatures and their potential value in understanding the late-Holocene tsunami record. The Holocene, 16 (8), 1095-1107.
Felton, A. & Crook, K. (2003). Evaluating the impacts of huge waves on rocky shorelines: an essay review of the book ‘Tsunami – the underrated hazard’. Marine Geology, 197, 1-12.
Gissing, A., Webb, R. & Hanslow, D. (2008). Emergency management of tsunami in New South Wales and the response to the Solomon Islands tsunami of April 2nd, 2007. The Australian Journal of Emeregency Management, 23 (3), 28-34.
Goff, J. & Dominey-Howes, D. (2009). Palaeotsunamis – does Australia and New Zealand have a shared prehistory? Earth Science Reviews, 97, 159-166.
Goff, J., Hulme, K. & McFadgen, B. (2003).“Mystic Fires of Tamaatea”: attempts to creatively rewrite New Zealand’s cultural and tectonic past. Journal of the Royal Society of New Zealand, 33(4), 795-809.
Goff, J. & McFadgen, B. (2003). Large earthquakes and the abandonment of prehistoric coastal settlements in 15th century New Zealand. Geoarchaeology, 18(6), 609-623.
Hall, G., Stevens, R. & Sexton, J. (2008). Tsunami planning and preparation in Western Australia: application of scientific modelling and community engagement. The Australian Journal of Emeregency Management, 23(4), 30-36.
Noormets, R., Crook, K. & Felton, E. (2004). Sedimentology of rock shorelines 3. Hydrdynamics of mega-clast emplacement and transport on a shore platform, Oahu, Hawaii. Sedimentary Geology, 172, 41-65.
Opper, S. & Gissing, A. (2005). Anticipating waves of destruction. Unpublished Report, 8pp. Available at: http://www.ses.nsw.gov.au/infopages/2276.html.
Papathoma, M. & Dominey-Howes, D. (2003). Tsunami vulnerability assessment and its implications for coastal hazard analysis and disaster management planning, Gulf of Corinth, Greece. Natural Hazards and Earth System Sciences, 3, 733–747.
Papathoma, M., Dominey-Howes, D., Zong, Y. & Smith, D. (2003). Assessing Tsunami vulnerability, an example from Herakleio, Crete. Natural Hazards and Earth System Sciences, 3, 377-389.
Dr Filippo Dall’Osso is a Research Fellow based at the Interdepartmental Centre for Environmental Sciences Research (CIRSA), University of Bologna, Italy and a member of the Australian Tsunami Research Centre, University of New South Wales. His PhD research focused on improving and applying methods for assessing the vulnerability of buildings to damage during tsunami and included the detailed Sydney case study referred to in this paper.
Associate Professor Dale Dominey-Howes is Co-Director of the Australian Tsunami Research Centre and Natural Hazards Research Laboratory, University of New South Wales. He leads a large team exploring multidisciplinary aspects of natural hazards and disaster risk reduction.