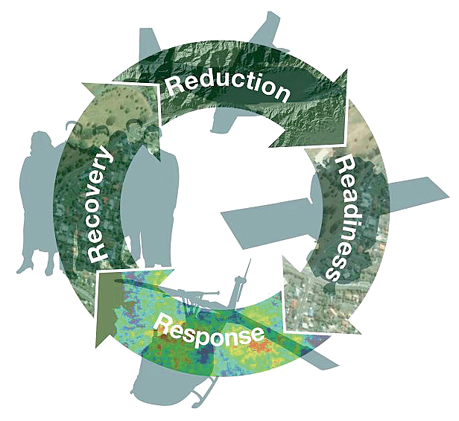
Remote sensing (satellite imagery and aerial photography) can provide a valuable source of information throughout the emergency management cycle (Figure 1), helping to understand spatial phenomena, and providing scientists and authorities with objective data sources for decision making. It can be used to assist risk reduction initiatives through identification of hazard zones associated with flood plains, coastal inundation and erosion, and active faults. It can also be used to verify hazard and loss models by measuring the location and magnitude of actual events. Imagery is widely used by meteorologists for providing weather forecasting and warnings of potentially severe weather events, providing the public and emergency responders with information that can assist decision making around short term readiness (preparedness). These images are commonly presented in print, television and on the internet, and they are well accepted by viewers around the world.
Figure 1. The emergency management cycle shown here using New Zealand terminology. Remote sensing can assist emergency managers with all phases of the cycle but requires collaboration between emergency managers and remote sensing technicians.
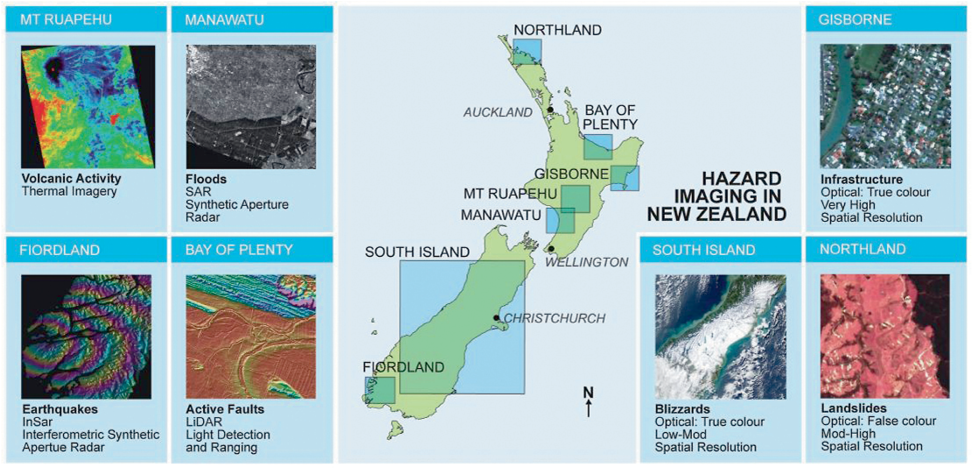
Imagery of fires, volcanic eruptions, and flooding are often used by the media during the response phase for the visual impact that they provide. If people in potentially at-risk locations personalise the risk, they are more likely to take readiness actions such as making emergency plans for contact and evacuation, and / or assembling emergency kits. Remote sensing images of similar communities experiencing hazards, or of the progress of a hazard such as a fire front, can assist with this personalisation process. For agencies that respond to emergencies, remote sensing imagery provides a method of assessing the magnitude of hazard impacts, areas most affected, and where key transport and other infrastructure links have been disrupted or destroyed. Remote sensing can also be used to provide information on the rate of recovery in an area post emergency, based on indicators such as debris removal, vegetation regrowth, and reconstruction. Additional examples of emergency management related applications of remote sensing are described in Table 1, while some specific data types related to this table are shown in Figure 2.
Table 1: Emergency management application examples using remotely sensed imagery
Application |
Type of Data |
Data Description |
Disadvantage |
Example |
|---|---|---|---|---|
Building and infrastructure, damage assessment |
Very high spatial resolution optical |
Black and white, colour, or colour infrared imagery where the pixel size is <4m (i.e. can detect individual buildings). May be from an airborne or satellite platform. |
Expensive, large volumes of data, generally only able to be used for local assessment (e.g. city or town scale) |
Infrastructure mapping using true colour pansharpened Quickbird imagery of an urban area in Gisborne |
Local to regional scale mapping and damage assessment. |
Moderate - High spatial resolution optical |
Black and white, colour, or colour infrared imagery where the pixel size is 4-30m. Buildings can be seen but not adequately delimited. |
Limited level of detail for infrastructure mapping |
Regional mapping of landcover and storm induced widespread landsliding in Northland using SPOT-5 |
Synoptic and frequent mapping at continent or country scale, weather forecasting, coastal upwelling and algal blooms |
Low spatial resolution optical |
Black and white, colour, or colour infrared imagery where the pixel size is 4-30m. Buildings cannot be seen. |
Low levels of detail |
Extent of snow cover following storms in the South Island using MODIS. Sediment flows into the sea on the west coast due to rain and landsliding are also apparent |
Weather forecasting, hotspot mapping (fires, volcanoes), sea surface temperature |
Thermal imagery |
Relatively coarse spatial resolution providing temperature information either locally or regionally dependent on the sensor |
Satellite thermal data has relatively low spatial detail |
Monitoring Crater Lake temperatures with ASTER as part of a suite of tools to assess volcanic activity on Mt Ruapehu |
Flood mapping (penetrates through cloud), search and rescue (can be used at night), oil spills |
Synthetic Aperture Radar |
Active microwave sensor that is capable of acquiring data in harsh weather and lighting conditions not suitable for optical sensors, such as dense cloud or smoke coverage |
Generally coarser resolution than that able to be achieved with optical imagery; Can be difficult to interpret |
Radarsat imagery of inundated areas during the Manawatu floods |
Monitoring sub centimetre surface deformations caused by earthquakes, landslides, volcanic activity, ground water extraction |
Interferometric Synthetic Aperture Radar |
Technique utilising wavelength phase changes in multiple SAR images in time series over a set area of interest |
Noise from changes unrelated to landform such as vegetation growth and soil moisture variability |
Using ALOS PALSAR to measure the amount of ground deformation following a magnitude 7.8 earthquake off the coast of Fiordland |
Building and infrastructure mapping, forest fuel loads, fault identification, flood plain mapping |
LiDAR |
Very high spatial resolution Imagery usually obtained from an airborne platform for the purpose of providing elevation information. Also used for building and tree height measurements |
Expensive, large volumes of data, generally only able to be used for local assessment (e.g. city or town scale) |
Active fault and floodplain mapping with airborne LiDAR |
Figure 2. Data types and examples. Note that the extent rectangles are not to scale and are indicative of location only.
In order to successfully use remote sensing for emergency management, physical indicators of features or attributes within the emergency management cycle that are measureable in imagery need to be identified. At that point, selection of the most appropriate remotely sensed data set is possible by answering the following questions:
No single image data source will provide the optimal solution under all circumstances. In addition, there is a necessary trade off between the amount of detail available within an image, its spatial coverage, and frequency of acquisition. Prioritising the information requirements (e.g. detail vs. coverage) will assist the data selection process. Specific requirements may also depend on the relevant phase of the emergency management cycle.
In the reduction (prevention) phase, the focus for remote sensing is often on mapping landscape features such as land cover / land use, and the location of potentially hazardous features or processes to avoid when developing infrastructure (e.g. active faults, flood plains). During the readiness (preparedness) phase, the emphasis is on monitoring these features or processes, developing models for forecasting purposes, and using maps and models for training and education. In the response phase, the timely acquisition of data and provision of information to emergency services is critical. Much of the attention will be placed on identifying infrastructure that has been damaged or is likely to be at risk in the near future (e.g. housing in the path of a bush fire). Finally, during the recovery phase, the focus will shift to long term monitoring of debris removal, vegetation regeneration, and reconstruction.
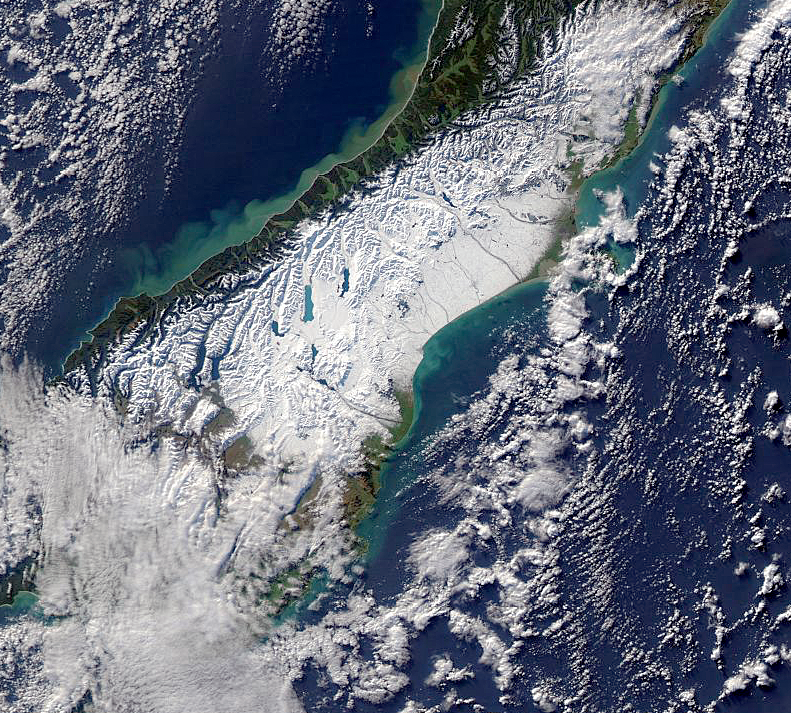
Remote sensing can be used directly for hazard identification (e.g. flood plain modelling, slope stability and landslide susceptibility) and also for extent mapping; using images to record large area / high consequence events (Figure 3) to add to hazards databases and assist hazard modelling). Remote sensing can also be used to derive hazard-independent information that can be used for risk reduction by mitigating vulnerabilities. For example building vulnerability, commonly termed fragility, can be determined using baseline building, infrastructure, and topographic mapping data for risk and consequence modelling. An excellent example of the use of remote sensing for hazard identification is provided with LiDAR (Light Detection and Ranging) mapping of active fault locations (Begg & Mouslopoulou, 2009 in press). Airborne LiDAR data penetrates through vegetation canopies to provide extremely high spatial resolution digital elevation information that can be used to detect the effects of faulting on the landscape. LiDAR data is also frequently used by councils to generate flood hazard maps.
Figure 3. Snow storm, South Island, New Zealand June, 2006 captured by the MODIS sensor on NASA’s Aqua satellite. Mapping of large area and / or high consequence hazard events enables expansion and verification of existing hazard and consequence models to incorporate extreme events.
Remotely sensed data acquisitions can be used to inform land use planning, a key tool that authorities and communities employ to avoid or mitigate hazard risk (Burby, 1998). By identifying the location and characteristics of hazards, land use planning methods can be applied to address the risk these hazards pose. Planning methods include mapping hazard zones (location and range of hazard impact) and identifying the probability of occurrence. Hazard maps are applied to developed and green field (undeveloped) land and options for risk treatment determined. Treatment options can include measures such as setback zones (no development within the hazard zone, e.g. proximal to active faults or within coastal erosion or inundation zones), or special building codes (e.g. minimum floor heights above base flood level) can be introduced to reduce the risk to assets and people (Godschalk et al., 1998). Understanding hazard information is one of a number of critical factors influencing individual and group decision making for risk management (Paton & Johnston, 2001). Where hazard information is readily available to the public in a variety of forms, including maps, there is a greater likelihood of public support for risk reduction initiatives introduced through land use planning (Burby, 2001).
Collecting asset data via high spatial resolution remote sensing allows for identification of infrastructure and buildings in hazardous locations, which can then be targeted for plans to strengthen or re-locate. Asset data is also essential for hazard consequence modelling, whereby hazard data is combined with asset data and fragility (vulnerability) information to determine potential losses. Building fragility to hazards is based on such factors as construction materials (e.g. earthquake, volcanic ash fall, tsunami hazard), engineering design (e.g. tsunami, landslide, earthquake hazard), building height (wind), floor areas (earthquake), proximity of other structures and vegetation (fire), roof pitch angle (e.g. ash fall, snow hazard), and floor height (e.g. flood, tsunami hazard). Remote sensing methods for collecting building and infrastructure data require high to very high resolution satellite or airborne imagery. Optical imagery is often complemented by LiDAR data, which can not only aid in detecting building edges, but is also used for calculating building heights. Incorporation of remotely sensed data into a GIS is vital during this phase for recording spatial attributes and combining with other data sets.
Remote sensing technology can also be applied to measure the success of risk reduction initiatives. A common method for addressing flood risk is the construction of levees to contain flood waters for an event of a given magnitude. Aerial reconnaissance during major flooding events can identify whether levees are performing to design standard and can identify areas of weakness, overtopping or failure. Monitoring of non-structural risk reduction initiates is also possible. To address coastal hazard erosion and inundation risk, many communities choose non-structural options such as beach renourishment and dune restoration. In Florida, airborne LiDAR captured over time has been applied to measure coastal erosion from hazards, alongside the success of non-structural beach restoration methods through determining changes to beach morphology (Shrestha et al., 2005). Another example of measuring the effects of risk reduction initiatives is analysing post-event images of rainfall induced landslides on land with different vegetation cover. From analysis of aerial photographs (oblique and vertical) of an event in 2004 which impacted the lower North Island of New Zealand, it was determined that vegetation cover played an important role in reducing loss of productive soil, and in reducing landslide hazard to assets (Hancox & Wright, 2005).
Readiness activities and planning are undertaken at a number of levels to increase resilience and response capability for individuals, households, organisations, and states or nations. The provision of good hazard and asset information to support these activities is essential. Crucial in this phase is to prepare an archive of, and gain familiarity with, the most up to date spatial information including (but not limited to) imagery, digital elevation models, and vector data. This information is required to assist with damage assessment during the response and recovery phases.
Remotely sensed data are used to produce high resolution hazard and risk maps, which are used by authorities to communicate information about location and range of hazards to their communities. If individuals believe that a hazard is likely to affect them detrimentally within an understandable and pertinent timeframe, they are more likely to take actions to prepare. These actions might include having emergency supplies in the home, an action plan for evacuation and emergency contact with other household members, first aid training or training as a civil defence volunteer. The principle of risk perception aiding preparedness applies to both static and dynamic hazards, e.g. fault trace or flood plain mapping vs. cyclone or bushfire progression. Remotely sensed images showing the progression of a bushfire front or the track of a cyclone are commonly used by emergency managers via the media to inform the public of where hazards are occurring and where they are likely to impact as they evolve. As community resilience research has shown, awareness of hazards is not the only factor in triggering actual preparedness actions; however it is one significant driver (Paton, 2006; Paton & Johnston, 2001; Ronan & Johnston, 2005).
From local to national scales, obtaining an overall picture of the hazardscape by identifying at–risk areas, and priority hazards for resources and planning is essential. Granger (2000) discusses the development of information infrastructure for emergency management in Pacific Island nations, based on remotely sensed data, and GIS interpretation. For countries with limited budgets, collaboration to purchase remotely sensed data for emergency planning is beneficial because of cost savings, the opportunities for skill and process sharing, and the consistency of data for modelling (Granger, 2000).
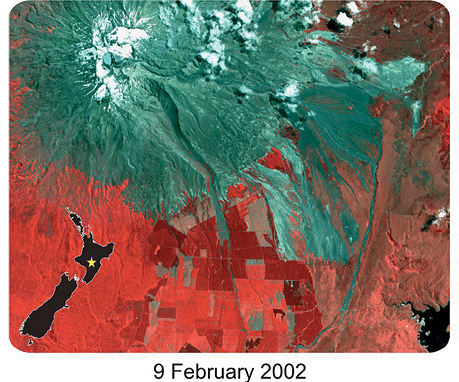
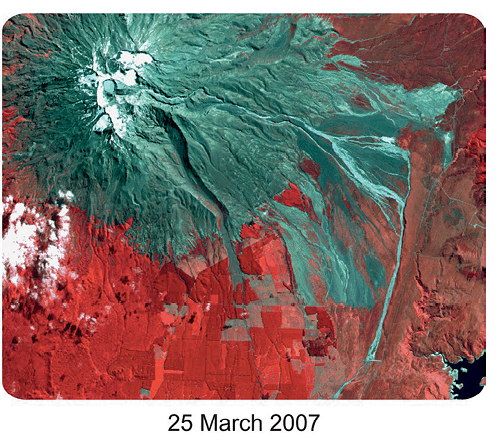
Hazard modelling is important for readiness, as for many hazards residual risk dictates that an effective emergency response will be the most practical solution for emergency management. For example, New Zealand has several active volcanoes; Mt Ruapehu is the largest of these. Ruapehu is a national park with two commercial ski fields in operation on its slopes. Depending on the time of year, visitors to the mountain are engaged in a variety of recreational, educational and scientific activities. The greatest hazards associated with the volcano are eruptive events and lahar flow (Carrivick et al., 2009). The volcano has a crater lake at the summit which produces periodic large lahars during eruptions and tephra dam bursts. In acknowledgement of the potential hazard to the nearby railway, state highway, and recreation areas, extensive modelling of potential lahar flow paths and velocities was undertaken based on high resolution remotely sensed data (Carrivick et al., 2009). The path later was verified using aerial photography, LiDAR, ASTER (Figure 4), and PALSAR imagery following a lahar in March 2007 (Joyce et al., 2009). The modelling provided the necessary hazard information for authorities to manage the risk through a suite of preparedness activities. A bund (levee) was constructed to prevent lahar flow onto the main highway; and a comprehensive monitoring and alarm system was constructed to detect lahar break outs. An integrated response plan involving emergency managers, police, the fire service, road managers, railways operators, ski field staff, scientists and national park managers, was developed to stop all trains outside the hazard zone, close the highway, trigger warnings and response plans at the ski fields (move people to ridges away from flow paths), and locate and evacuate any hikers or workers in hazard zones within the national park (Leonard et al., 2005).
Figure 4. Mt Ruapehu before and after the lahar captured by the ASTER sensor on NASA’s Terra satellite. The path of the lahar can be seen as a bright feature originating at the summit Crater Lake, flowing down the eastern flank of the mountain and finally down the Whangaehu River.
Lahar flows and eruptions remain an ongoing hazard at Mt Ruapehu. To assist with preparedness for these hazards, remote sensing is part of the suite of monitoring systems employed to detect changes in volcanic activity. A combination of synthetic aperture radar, thermal imagery, and UV / visible imagery is acquired on a routine basis for monitoring deformation, Crater Lake temperatures and gaseous emissions respectively.
As timeliness is a critical factor in the response phase, it is important to have systems in place pre-event to aid with appropriate data selection so that crucial decisions need not be made under the severe time constraints that are necessitated by rapid response. Preparation may therefore involve developing a range of scenarios representing potential impacts that require rapid response at a set location, and applying the principles of data selection and processing in advance. In this way, the decisions regarding remote sensing in the response phase can actually be made during the readiness phase. This should be done as a collaborative exercise between both remote sensing experts and emergency management agencies.
Response activities are primarily focussed on protecting life and property during emergencies. Activities such as evacuations, search and rescue, sandbagging along riverbanks, evaluating building safety, establishing immediate emergency shelter, setting up command posts and other short-term tasks fall into the response phase. Remote sensing can be used during this phase to provide immediate damage assessment if the data can be provided in a timely manner, and also to assist evacuation plans through the combination of observing weather patterns and hazard behaviour (e.g. fire front approaches, water level rises). Ideally, recovery activities commence coincident with the response phase, to ensure an integrated process for holistic recovery. This means that damage assessments undertaken via remote sensing during the response phase will also be integral to the recovery phase.
Despite the often spectacular nature of imagery captured during an emergency event, the use of remote sensing during the response phase has experienced mixed levels of success, particularly in the case of satellite platforms. Regional scale imagery of effects associated with the development of fire fronts (hot spot detection), volcanic eruptions (gas and ash emissions), or tropical cyclones (inundation) is generally successful where the area of impact is sufficiently large. For example, Geoscience Australia currently utilise thermal-infrared satellite data to provide synoptic, 2-4 times-daily hot-spot detection of fire across Australia and New Zealand, while GNS Science uses ultra violet imagery to monitor sulphur dioxide emissions from volcanoes in New Zealand and across the southwest Pacific, allowing aircraft to avoid potentially hazardous volcanic ash and gas plumes. Providing local scale imagery for damage assessment purposes is more challenging due to the less frequent overpass times by satellites capable of acquiring imagery with high levels of spatial detail.
Relatively recent initiatives within the space science community are addressing the need for providing remotely sensed imagery for the purposes of emergency response. The launch of satellite constellations such as Rapid Eye and the Disaster Monitoring Constellation (International collaboration between Algeria, China, Nigeria, Turkey and the UK) are designed to provide more frequent moderate to high resolution imagery than that achievable with a single satellite. There are also avenues for collaboration between international organisations for data acquisition and provision in the event of emergencies, such as the International Charter for Space Based Disasters (Ito, 2005), and Sentinel Asia (Kaku et al., 2006). While potentially providing a considerable amount of data, neither of these tools can yet be used for immediate or first response due to the current time delay between requesting and receiving data. As such, research into airborne platforms has proven to be of greater utility for rapid data and information provision.
Between 2006 and 2008, the National Aeronautics and Space Administration (NASA) and the U.S. Forest Service collaborated to evaluate and demonstrate the use of long-duration, large Unmanned Airborne Systems (UAS), innovative sensing systems, real-time onboard processing, and data delivery and visualisation technologies to improve the delivery and usefulness of remote sensing data on wildfire events. The objectives were to demonstrate the capabilities of providing sensor-derived, GIS-compatible, geo-rectified, processed data on wildfire conditions to incident management teams within 15-minutes of acquisition from the sensors on the UAS (Figure 5). The characteristics of this system render it ideal for emergency response events that are not just isolated to wildfire. Data were used to support the emergency evacuation decision of the entire population of the community, an effective demonstration of the criticality of near-real-time remote sensing information supporting emergency management operations.
Figure 5. Imagery displayed for the incident response team in San Diego.
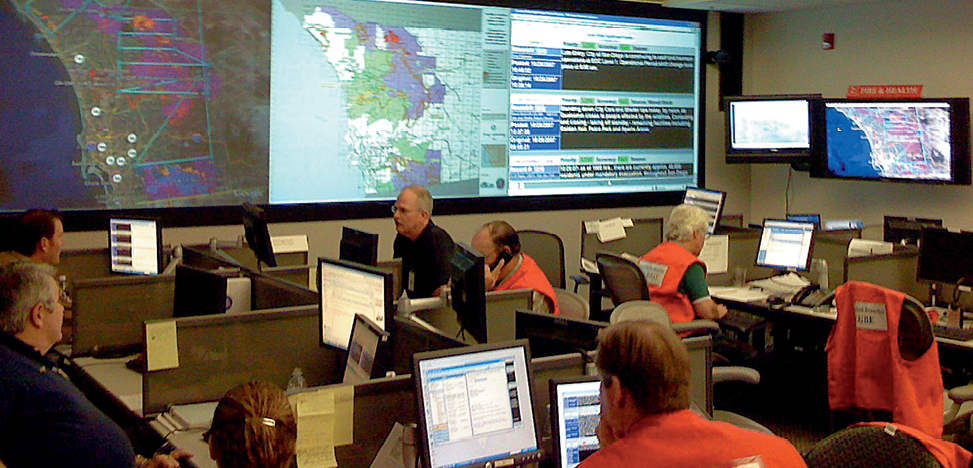
One of the key factors to the success of this system is the provision of not only data, but of information that can be ingested and utilised immediately by emergency managers to aid their decision making. Part of this speed of information delivery is attributed to the autonomous processing onboard the UAS to create geo-rectified image raster products (GeoTIFF) and hot-spot detection vector files (.shp files). The products generated with this system are transmitted via the onboard telemetry system, through a communications satellite to servers on the ground, where they are automatically processed into files compatible with Google Earth and made available in near-real-time at NASA servers. The combination of the near-real-time imagery and the simple Google Earth visualisation capabilities are a powerful tool that requires minimal (or no) training in its employment. Embedding a remote sensing specialist within the emergency management team can further assist with data integration, information understanding, and fielding specialized requests.
The key components to the “usefulness” of the data were the timeliness of the information (from acquisition to product delivery) and the simple format in which the data was available for visualisation and decision-making. While these factors are important at all stages of the emergency management cycle, they become particularly critical during the response phase, where rapid decision making is most important. The provision of simple hotspot information also means that the emergency management team is not overwhelmed with too much data or too many visualisation options. The choice of using Google Earth as a “front-end” display of the data was a careful decision to provide information in a format and software system that was easily operated and readily available to the fire management community. Fire Incident Command team members do not have the time to “learn” new software capabilities or new tools while they are in the midst of a major wildfire management activity. Google Earth provided a user-friendly capability to allow quick data integration, zoom capabilities, 3-D visualisation and ease of use.
The use of remote sensing to aid or monitor recovery is perhaps the least developed application of this technology. However, this is an area where the remote sensing community could contribute a great deal through the provision of objective time series analysis over large areas with both high and medium levels of spatial detail. In other specialisations, time series analysis of remotely sensed data is an established technique. Environmental applications such as deforestation and urban sprawl are common targets. In each case, the monitoring objective is clear. During recovery, there are often some very clear indicators that can easily be measured and monitored with remote sensing imagery. Some of these indicators include construction and subsequent removal of medium and long-term emergency shelters; debris removal; commencement and completion of new construction or reconstruction (buildings, bridges, roads); vegetation regrowth; and reduction of siltation from waterways after flooding events.
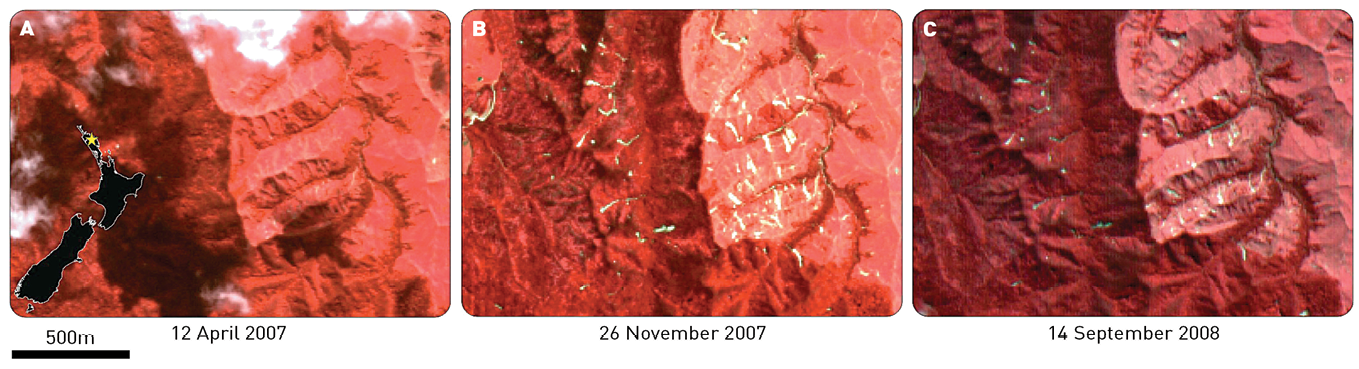
Recovery rates following a widespread landsliding event in northern New Zealand can also be seen from a series of SPOT-5 and ALOS AVNIR-2 imagery (Figure 6). Here the landsliding is apparent as bright scars in the colour infra red imagery acquired four months after the event (Figure 6b). One year later, recovery of many of the grassy slopes on the eastern portion of the image can be seen, while the landslides in the western region are also becoming overgrown (Figure 6c). In an area that was covered with many thousand landslides (Joyce et al., 2008), satellite remote sensing is the only time and cost effective manner of data collection for understanding land cover or land use recovery in the area. Similar techniques could be used to look at native habitat regeneration following bushfires.
Figure 6. Recovery of vegetation after a widespread landsliding event in northern New Zealand, July 2007. (a) SPOT-5 CIR obtained before the event; (b) SPOT-5 CIR obtained shortly after the event; (c) ALOS AVNIR-2 CIR imagery obtained one year later.
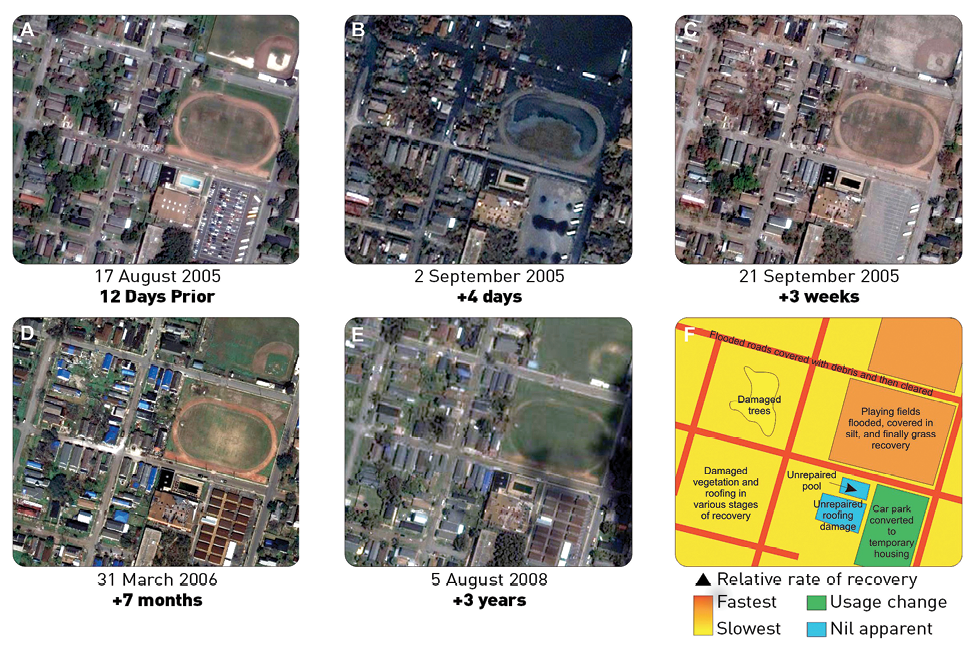
Using high spatial resolution, the amount of housing reconstruction can at least be visually identified by the presence and absence of blue tarpaulins covering roofs following Hurricane Katrina (Hill et al., 2006). Conceivably an automated detection method could be developed to identify these quickly and repeatedly in a time series dataset. The authors also provide a list of other recovery related features observable over time with high spatial data, such as building reconstruction, vegetation regrowth, presence of earth moving equipment, and debris removal (Hill et al., 2006). In Figure 7, the progression of recovery in a small area of New Orleans can be seen with high resolution data. Notable features in the image acquired a week before the hurricane are a large car park, sporting fields, and residential housing (Figure 7a). The progression clearly shows inundation in this area (Figure 7b), and remaining sediment shortly after the water subsidence (Figure 7c). By March 2006, temporary housing is evident in the location of the car park (Figure 7d), and is still visible three years after the event, though the number of roofs covered in blue tarpaulins has decreased (Figure 7e). An analysis of the relative rate of change is given in Figure 7f, demonstrating that impervious surfaces and lines of communication such as roads moved towards recovery quite quickly after the event, while mature vegetation takes somewhat longer. Some roofing damage and a swimming pool appear to remain in an unrepaired state three years after the event. The key here is that a time series of data is vital to determine if any change is occurring, and to further extract rates of change.
Figure 7. Time series of high resolution imagery in New Orleans (a) Before Hurricane Katrina; (b) Soon after the height of the storm; (c-e) Various time intervals following the recovery process; and (f) Interpreted rate of recovery. Images are © Digital Globe and Google Earth 2009.
Pre-event recovery planning is the process of identifying at–risk land uses prior to hazard events and considering how these land uses will be repaired, reconstructed or relocated following damage (Becker et al., 2008). With regards to pre-event recovery planning, remote sensing can be used to identify areas outside hazard zones that would be suitable for relocation of land uses that cannot be recovered. It can also be used for determining how many community facilities are at risk and what the priorities will be for recovery managers (e.g. critical lifelines infrastructure, schools, and other assets that contribute to rapid and holistic community recovery).
Analysis of time series imagery could also help to monitor the effectiveness of different recovery strategies. By extracting recovery rates from data acquired at appropriate time intervals, this assessment could help guide recovery plans for future events of a similar nature. This would also help identify areas of residual risk that require ongoing monitoring until the physical recovery process is completed.
Remote sensing can be used to inform many aspects of the emergency management cycle. An exhaustive coverage of all potential applications would be impossible in a single article; however we have shown several good examples from which inspiration can be sought for future use. It is important to consider all aspects of emergency management, rather than focussing on emergency response. Incorporating remote sensing into reduction and readiness activities, can also educate politicians, emergency management staff, remote sensing technicians, and the community about the applications of remote sensing to emergency management so that they are familiar with its use under a response and inherently pressured situation.
The key to facilitate the usefulness of remote sensing data in support of the emergency management community is being able to provide the appropriate information in a spectrally, temporally, and spatially relevant context. Additionally, one must be aware of the information requirements of that emergency management community, and must tailor the remote sensing information to meet those needs. That can only come through close collaboration between the emergency management community and the remote sensing / geospatial community.
This article has been revised from previously published work by the authors (Joyce et al., 2009 in press). All SPOT 5 imagery used in this article is © CNES; ASTER imagery was provided by the USGS. This article incorporates ALOS data which is © Japan Aerospace Exploration Agency ("JAXA") (2008). The data has been used in this article with the permission of JAXA and the Commonwealth of Australia (Geoscience Australia) ("the Commonwealth"). JAXA and the Commonwealth have not evaluated the data as altered and incorporated within the manuscript, and therefore give no warranty regarding its accuracy, completeness, currency or suitability for any particular purpose. Thank you to Andy Gray and Kitty Higbee for assistance with graphics and to Wendy Saunders and Maureen Coomer for article review.
Becker, J., Saunders, W., Hopkins, L., Wright, K., & Kerr, J. (2008). Pre-event recovery planning for use in New Zealand: An updated methodology. GNS Science Report 2008/11: GNS Science.
Begg, J. G. & Mouslopoulou, V. (2010). “Analysis of late Holocene faulting within an active rift using lidar, Taupo Rift, New Zealand”. Journal of Volcanology and Geothermal Research, 190 (1-2), 152-167.
Burby, R. J. (1998). "Natural hazards and land use: An introduction". In R. J. Burby (Ed.), Cooperating With Nature: Confronting Natural Hazards with Land Use Planning for Sustainable Communities: 1 - 26. Washington D.C.: Joseph Henry Press.
Burby, R. J. (2001). "Involving citizens in hazard mitigation planning: Making the right choices". Australian Journal of Emergency Management, 16, 45 - 51.
Carrivick, J. L., Manville, V., & Cronin, S. (2009). "A fluid dynamics approach to modelling the 18th March 2007 lahar at Mt. Ruapehu, New Zealand". Bulletin of Volcanology, 71, 153-169.
Godschalk, D. R., Kaiser, E. J., & Berke, P. R. (1998). "Integrating hazard mitigation and local land use planning". In R. J. Burby (Ed.), Cooperating With Nature: Confronting Natural Hazards with Land Use Planning for Sustainable Communities: pp 85-118. Washington D.C.: Joseph Henry Press.
Granger, K. (2000). "An information infrastructure for disaster management in Pacific Island Countries". Australian Journal of Emergency Management, 15(1), 20 - 32.
Hancox, G. T. H. & Wright, K. (2005). Analysis of landsliding caused by the 15-17 February 2004 rainstorm in the Wanganui-Manawatu hill country, southern North Island, New Zealand, GNS Science Report: 64: Institute of Geological and Nuclear Sciences.
Hill, A. A., Keys-Mathews, L. D., Adams, B. J., & Podolsky, D. (2006). "Remote sensing and recovery: A case study on the Gulf Coasts of the United States". Paper presented at the Fourth International Workshop on Remote Sensing for Post-Disaster Response, Cambridge, UK.
Ito, A. (2005). "Issues in the implementation of the International Charter on Space and Major Disasters". Space Policy, 21(2), 141.
Joyce, K. E., Dellow, G. D., & Glassey, P. J. (2008). "Assessing image processing techniques for mapping landslides". Paper presented at the IEEE International Geoscience and Remote Sensing Symposium, Boston, MA.
Joyce, K. E., Samsonov, S., Manville, V., Jongens, R., Graettinger, A., & Cronin, S. (2009). "Remote sensing data types and techniques for lahar path detection: A case study at Mt Ruapehu, New Zealand". Remote Sensing of Environment, 113, 1778 - 1786.
Joyce, K. E., Wright, K. C., Samonsov, S. V., & Ambrosia, V. G. (2009). "Remote sensing and the disaster management cycle", Geoscience and Remote Sensing. Vienna: In-Tech Publishing 317-346.
Kaku, K., Held, A. A., Fukui, H., & Arakida, M. (2006). "Sentinel Asia initiative for disaster management support in the Asia-Pacific region". Paper presented at the SPIE.
Leonard, G. S., Johnston, D. M., & Paton, D. (2005). "Developing effective lahar warning systems for Ruapehu". Planning Quarterly, 158, 6-9.
Paton, D. & Johnston, D. (2001). "Disaster and communities: vulnerability, resilience and preparedness". Disaster Prevention and Management, 10, 270-277.
Paton, D. (2006). "Disaster resilience: Integrating individual, community, institutional and environmental perspectives". In D. Paton & D. Johnston (Eds.), Disaster resilience: An integrated approach: 320. Springfield: Charles C Thomas Publisher.
Ronan, K. R. & Johnston, D. M. (2005). "Promoting community resilience in disasters : the role for schools, youth, and families". New York: Springer.
Shrestha, R. L., Carter, W. E., Satori, M., Luzum, B. J., & Slatton, K. C. (2005). "Airborne Laser Swath Mapping: Quantifying changes in sandy beaches over time scales of weeks to years". ISPRS Journal of Photogrammetry & Remote Sensing, 59, 222 - 232.
Karen Joyce graduated with a PhD in Geographical Sciences from the University of Queensland in 2005 and is currently a lecturer in Remote Sensing at Charles Darwin University. Her work on this manuscript was completed while employed as a Remote Sensing Scientist in the Natural Hazards group at GNS Science. Email karen.joyce@cdu.edu.au
Kim Wright has her MSc (Hons) in Physical Geography from Victoria University, Wellington and is currently studying for a Masters of Emergency Management with Massey University. She is a Hazards Planning Scientist in the Social Science team at GNS Science. Email k.wright@gns.cri.nz
Vince Ambrosia has an MS in geography with a specialization in remote sensing from the University of Tennessee (1980). He is currently a Senior Research Scientist and Adjunct Faculty member of California State University – Monterey Bay, working at NASA-Ames Research Centre, California on wildfire observations with remote sensing systems on Unmanned Aerial Vehicles. Email Vincent.G.Ambrosia@nasa.gov
Sergey Samsonov has a PhD degree in Geophysics and Environmental Science from the University of Western Ontario. He is currently a SAR Remote Sensing Scientist with the Natural Hazards group at GNS Science and an Adjunct Professor at the Department of Earth Sciences, University of Western Ontario. Email ssamson@uwo.ca