Submitted: 15 June 2017. Accepted: 13 September 2017.
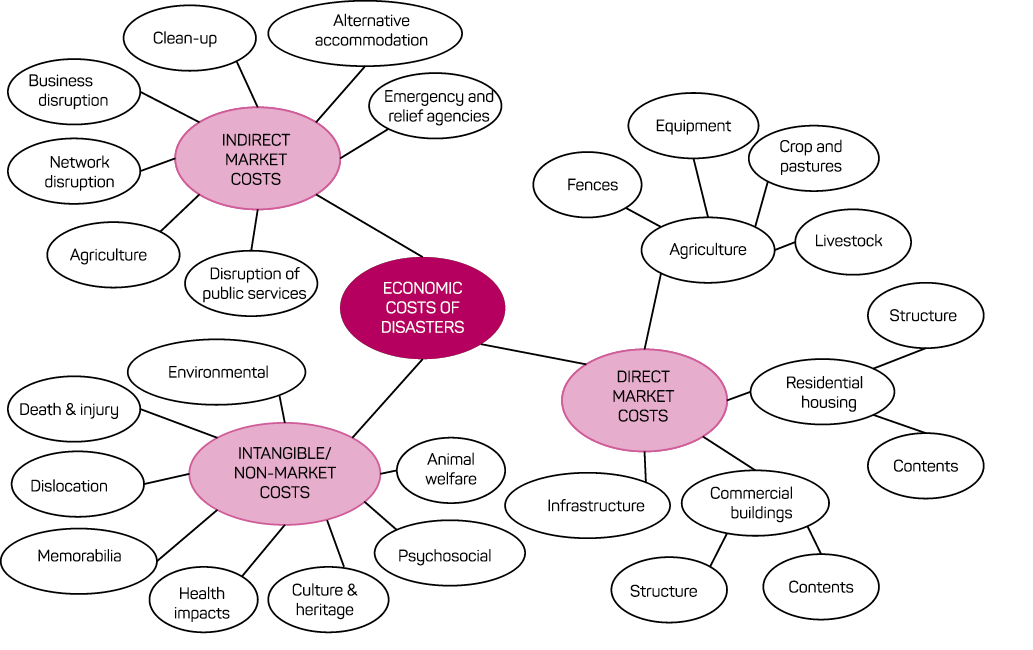
To be able to select the most beneficial mitigation option for floods, management agencies need information on a broad set of disaster impacts: direct and indirect, tangible (market) and intangible (non-market) impacts. Direct market losses are those directly caused by the flooding water, resulting from the physical damage to buildings, their contents, infrastructure, etc. Indirect market losses correspond to the flow-on effects caused by the flood, such as business disruptions and clean-up costs that may occur inside or outside the flooded area and can span over a long period. Floods can also cause direct and indirect damages to things that cannot be easily measured in monetary terms (intangible values), such as environmental assets and social values (see Figure 1). Tangible flood losses are usually well documented but intangible losses are typically ignored because they are difficult to quantify. Intangible goods and services are not exchanged in markets and do not have prices, thus assigning dollar values to them is a complex exercise that requires resources and specialised knowledge. However, intangible losses may be substantial, and in some cases, more important to people than tangible losses (Joseph, Proverbs & Lamond 2015). Ignoring intangible impacts may lead to sub-optimal decisions.
One of the shortcomings of standard benefit-cost analyses (BCAs) is that they rarely include intangible values (Hammond et al. 2015, Hansson, Danielson & Ekenberg 2008). For floods, only DEFRA/EA (2005) and Joseph and colleagues (2015) have estimated the dollar values of intangible impacts, but these values have not been incorporated into BCAs. The purpose of this paper is to incorporate intangible flood losses into a BCA, using the Brown Hill and Keswick creeks catchment in Adelaide as a case study. This approach is also relevant to other natural hazards, and economic analyses of mitigation for other hazards need to include intangible impacts.
The catchment has four creeks that are important drainage watercourses in metropolitan Adelaide (see map in Figure 2). The five councils in the catchment (Adelaide, Burnside, Mitcham, Unley and West Torrens) have a combined population of 233,000 (about 86,000 households) and 38,000 businesses. About 2,090 households and 350 businesses are located in the 100-year floodplain, including Adelaide airport. The risk of flooding is relatively high, but until recently there were no clear plans for mitigation due to a lack of agreement between the councils affected (BHKCP 2016). Widespread flooding has not occurred since the 1930s, but the catchment has experienced moderate flooding in recent years (2005, 2016).
The purpose of the planned works is to mitigate the impact of major flooding in the area up to a 100-year average recurrence interval (ARI) flood. The catchment experiences flash flooding, which means that there would be little or no warning before a flood occurs and limited time to prevent direct flood losses. Thus, large structural works are necessary to mitigate flood impacts. The works are divided into two parts (BHKCP 2016):
In this study Part A was evaluated and three options from Part B (B1, B2 and D). Options B1 and B2 involve the construction of dams in a recreational park and have generated considerable community opposition.
The economic attractiveness of each option is evaluated against a baseline scenario of doing nothing (i.e. no mitigation). The most recent BCA conducted for the mitigation works (BHKCP 2016) includes damages to residential, commercial and industrial properties, infrastructure, clean-up costs, emergency assistance grants and business disruptions. Because Adelaide airport is located in the catchment, business and infrastructure disruption could be significant. In BHKCP (2016), impacts on the airport were estimated through interviews with airport owners and other stakeholders. Although the importance of intangible losses was recognised, only tangible flood losses were assessed. Table 1 shows these losses per event as reported in BHKCP (2016).
Table 1. Tangible flood losses per event (AUD ’000).
| ARI (years) | Base case | Part A | Parts A + B | ||
|---|---|---|---|---|---|
| B1 | B2 | D | |||
|
10 |
4,800 |
- |
- |
- |
- |
|
20 |
10,600 |
- |
- |
- |
- |
|
50 |
45,000 |
9,000 |
400 |
400 |
400 |
|
100 |
122,200 |
30,500 |
810 |
810 |
810 |
|
500 |
434,400 |
181,700 |
181,700 |
181,700 |
181,700 |
|
PMF* |
1,000,000 |
1,000,000 |
1,000,000 |
1,000,000 |
1,000,000 |
Losses per event are converted to average annual losses (AAL) that combine the losses per event with the probability of each event. The benefits of mitigation correspond to reductions in AAL. Table 2 shows the results reported in BHKCP (2016).
Table 2. Tangible average annual losses for different scenarios (AUD ‘000).
| Tangible damage | Base case | Part A | Parts A + B | ||
|---|---|---|---|---|---|
| B1 | B2 | D | |||
|
AAL |
5,966 |
2,228 |
1,918 |
1,918 |
1,918 |
|
Reduction in AAL |
3,738 |
4,048 |
4,048 |
4,048 |
|
Intangible values can be estimated by surveying people to elicit their preferences and inferring from their answers their willingness to pay (WTP) for intangible assets (Johnston, Rosenberger & Rolfe 2015). These techniques are usually resource-intensive and expensive, and thus an alternative method has been developed, called ‘benefit transfer’, which involves transferring values from existing studies and adjusting them to a different context (Johnston, Rosenberger & Rolfe 2015).1 Since there are no studies estimating WTP for avoiding intangible flood impacts in the case study area, the benefit transfer method is relevant to this analysis. Although high uncertainty is attached to the values derived from overseas studies, it is better to include information with uncertainty than to ignore it completely (Pannell & Gibson 2016). A sensitivity analysis was conducted to deal with the uncertainty associated with these estimates. Table 3 provides details on the intangible values included in the analysis, how these values were estimated, and the dollar values assigned to them. For more information on the references reviewed, see Chalak and colleagues (2017).
Table 3. Intangible values, analysis and estimated dollar values (AUD).
| Intangible item | Definition | Dollar value | (2016) | Method used for estimating each intangible |
|---|---|---|---|---|
|
Mortality |
Value of a statistical life (VSL) (per person) |
4,320,000 |
The number of fatalities was estimated as a function of likely flood depth in the catchment for different ARI floods. Total number of fatalities was then multiplied by the VSL. |
|
|
Morbidity |
WTP to avoid or reduce flood-related health impacts (per household per year) |
516 |
Morbidity costs were estimated annually for the total number of households at the risk of a 100 year ARI flood under the different mitigation options. DEFRA/EA (2005) surveyed people exposed to this level of risk in the UK. This value was adjusted for income differences. |
|
|
Recreation |
WTP for recreation in an urban park (per household per year) |
35 (for users of the park) 17 (for non-users) |
WTP for user (non-users) of an urban recreation park in Australia was adjusted for income and multiplied by the annual number of visitors to the park (nearby residents). |
|
|
Electricity outage |
WTP to avoid an electricity outage (per household for a 12 hours outage) |
71.0 |
WTP estimates from the literature were adjusted for income and multiplied by the number of households that would experience electricity outage in the event of a flood. |
|
|
Road traffic annoyance |
WTP to avoid noise-related traffic annoyance (per person affected per flood) |
1.6 |
WTP to avoid noise-related traffic annoyance was adjusted for income differences and multiplied by the potential number of people affected. |
|
|
Road traffic delays |
The value of time reliability (per person per hour) |
38.0 |
The value of time reliability was multiplied by the potential number of people affected by road traffic delays. A conservative delay of 0.5 hours was assumed. |
|
|
Inability to return home |
WTP to avoid the inconvenience of being displaced (per household per hour) |
5.4 |
WTP to avoid the inconvenience of being displaced was adjusted for income differences and multiplied by the potential number of people affected. |
|
|
Cultural heritage |
WTP for the protection of one monumental tree (per household per year) |
1.7 |
WTP for the protection of one monumental tree was adjusted for income differences and multiplied by the number of nearby residents. |
AAL for intangible values are presented in Table 4. The largest intangible value is morbidity, as people put relatively high values on reducing flood-related stress. The second largest intangible value is road traffic delays that would affect a large number of people. Conversely, mortality is low because flood fatalities are rare in the catchment. Other intangible losses are also low, primarily because floods in the area tend to recede relatively fast (BHKCP 2016). Recreation and cultural heritage have a value of zero for the base case (there is no loss without mitigation) but an annual intangible loss is incurred by the construction of a dam (options B1 and B2).
Table 4. Average annual losses for intangible values (AUD).
| Intangible value | Base case | Part A | Parts A + B | ||
|---|---|---|---|---|---|
| B1 | B2 | D | |||
|
Caused by flood events |
|||||
|
Mortality |
5 |
2 |
2 |
2 |
2 |
|
Electricity outage |
3,900 |
1,500 |
900 |
900 |
900 |
|
Road traffic annoyance |
1,100 |
400 |
200 |
200 |
200 |
|
Road traffic delays |
550,200 |
166,200 |
101,400 |
101,400 |
101,400 |
|
Inability to return home |
14,200 |
5,500 |
3,300 |
3,300 |
3,300 |
|
Arising from the risk of flooding |
|||||
|
Annual morbidity costs |
1,077,000 |
311,400 |
16,000 |
16,000 |
16,000 |
|
Caused by a mitigation option |
|||||
|
Annual loss in recreation |
0 |
0 |
32,300 |
32,300 |
0 |
|
Annual loss in cultural heritage |
0 |
0 |
10,000 |
0 |
0 |
|
Total |
1,646,500 |
485,100 |
164,000 |
154,200 |
121,900 |
The combined AAL figures for tangible and intangible values are shown in Table 5. When intangible values are accounted for, AAL are between 8 per cent and 23
Table 5. Tangible and intangible average annual losses for different scenarios (AUD ‘000).
| Type of damage | Base case | Part A | Parts A + B | ||
|---|---|---|---|---|---|
| B1 | B2 | D | |||
|
Tangibleλ |
5,966 |
2,228 |
1,918 |
1,918 |
1,918 |
|
Intangible |
1,647 |
485 |
164 |
154 |
122 |
|
Total |
7,613 |
2,713 |
2,082 |
2,072 |
2,040 |
|
Reduction in AAL |
4,899 |
5,531 |
5,541 |
5,573 |
|
These benefits need to be compared to the costs. The costs of implementing Part A alone are $111 million and the costs of Part B are $41, $44 and $36 million for options B1, B2 and D, respectively. Since Part B is an add-on to Part A, total costs are the sum of Parts A and B. Therefore, the total costs of combining Part A with options B1, B2 or D are $152, $155 and $147 million, respectively. These costs are assumed to be spread over a period of seven years, the time that it will take to complete the works (BHKCP 2016). They also include asset maintenance costs over 30 years.
The benefits are fully realised after completion of the works and only partially realised before that. For present value calculations, a time horizon of 30 years and a discount rate of 6 per cent were used, consistent with the original analysis in BHKCP (2016). The benefit-cost ratios (BCR) and the present values used to calculate them are presented in Table 6.
Table 6. Present values and benefit-cost ratios (AUD million).
| Option → | Part A | Parts A + B | ||
|---|---|---|---|---|
| B1 | B2 | D | ||
|
Present value of benefits |
38.5 |
44.0 |
44.0 |
44.3 |
|
Present value of costs |
88.5 |
121.1 |
123.7 |
116.8 |
|
Net present value |
-50.0 |
-77.2 |
-79.7 |
-72.5 |
|
Benefit-cost ratios |
0.44 |
0.36 |
0.36 |
0.38 |
Part A generates a benefit-cost ratio of 0.44. This means that every dollar invested in Part A generates only $0.44 in benefits. The option that generates the highest benefits is option D ($44.3 million) but the costs ($116.8 million) are much higher, resulting in a benefit-cost ratio of 0.38 (even smaller than for Part A alone). None of the options considered pass the benefit-cost ratio test. In this particular case study, adding intangible values does not change the attractiveness of the options significantly. Intangible losses remain relatively small, representing only between 6 per cent and 21 per cent of total losses. The strong opposition from the community to the construction of the dams is not adequately reflected in the intangible values estimated here. Losses in recreation and cultural heritage are small compared to tangible losses. Although no survey has been conducted to assess people’s WTP for having or not having a dam constructed in the recreation park, the fact that the catchment has not experienced major flooding in many years (BHKCP 2016) may contribute to the community’s resistance towards the dams, because the discomfort of flooding is not experienced frequently enough to tilt the balance towards supporting additional mitigation measures.
In this study, conservative (lower-bound) values for intangible were used but since no survey was conducted to estimate them, there is a high level of uncertainty attached to these figures. Therefore, it is useful to evaluate how sensitive the results are to changes in intangible values.
For the sensitivity analysis, all intangibles were increased by 200, 500 and 700 per cent (Table 7). Regardless of the increase in intangible values, the option that generates the largest benefits is still the combination of Part A with option D. However, on the basis of benefit-cost ratios, Part A generates higher returns up to an increase in intangibles of 700 per cent. Beyond this point, option D becomes more attractive.
Table 7. Results with increases in intangible values (AUD million).
| Increase in value (%) | Part A | Parts A + B | ||
|---|---|---|---|---|
| B1 | B2 | D | ||
|
Present value of benefits |
||||
|
200 |
56.0 |
68.7 |
68.9 |
69.8 |
|
500 |
82.2 |
105.9 |
106.4 |
108.0 |
|
700 |
99.7 |
130.7 |
131.3 |
133.5 |
|
Net present value |
||||
|
200 |
-32.5 |
-52.4 |
-54.7 |
-47.0 |
|
500 |
-6.3 |
-15.2 |
-17.3 |
-8.8 |
|
700 |
11.1 |
9.6 |
7.6 |
16.7 |
|
Benefit-cost ratios |
||||
|
200 |
0.63 |
0.57 |
0.56 |
0.60 |
|
500 |
0.93 |
0.87 |
0.86 |
0.92 |
|
700 |
1.13 |
1.08 |
1.06 |
1.14 |
For the mitigation options to pass the benefit-cost ratio test, intangible values need to be increased by at least 700 per cent. For such numbers to be valid, households located in the 100-year floodplain would have to be willing to pay roughly $6,000 per year to avoid intangible flood impacts. However, this is unlikely unless people are exposed to more frequent flooding. The literature on this topic shows that households are, on average, willing to pay up to $1,864 per household per year to reduce all flood impacts, and about $1,177 per household per year to avoid intangible flood impacts (Joseph, Proverbs & Lamond 2015, Owusu, Wright & Arthur 2015).
Intangible values were incorporated into a BCA of flood mitigation for the Brown Hill and Keswick catchment in Adelaide. The results show that the most substantial intangible values in terms of AAL are morbidity and road traffic delay. However, intangible losses remain relatively small compared to tangible losses, representing only between 6 per cent and 21 per cent of total losses.
This study showed that, although intangible values are important, their inclusion does not always significantly change the economic attractiveness of mitigation options. After including intangible values, all options still generate benefit-cost ratios below one. This may be explained by several factors. First, the costs of the mitigation works are substantial; in other flood-risk areas, mitigation may not be as expensive. Second, conservative estimates were used and, since no survey was conducted, there is a lot of uncertainty about the magnitude of these estimates. Third, the catchment is relatively small and is not subject to very frequent flooding. Fourth, other people who would be affected, such as visitors to the catchment and business employees, are not included in the model. Fifth, climate change has not been incorporated in the analysis, which may cause frequent flooding and increase the WTP of residents to avoid damages (and increase the benefits of mitigation). Finally, some intangible values have not been included such as the WTP to avoid losing memorabilia, dealing with insurers or enduring the recovery process.
Some of the information used here was taken from studies evaluating different flooding environments. This catchment would experience flash floods, which are particularly dangerous because water levels increase rapidly and many people could be caught by surprise inside the flooding area. Although efforts were made to adapt the different values to the context of the case study area, another limitation is that studies from different contexts, both physically and socially, have been relied on and this increases the level of uncertainty. It is acknowledged that using information from different environments is a limitation in the study. Also, flood impacts are highly contextual and determined by many factors including flood depth, velocity, warning time, duration of isolation and time of the day. If a flood occurs during the night, it would cause less disruption to traffic. However, this has not been accounted for in the model. Despite these limitations, this study is a step forward in the inclusion of intangible values in economic analyses of flood management.
To better understand intangible flood impacts on this catchment, additional information needs to be obtained from a non-market valuation survey. Such a study would generate more accurate estimates than the benefit transfer method. However, original non-market valuation studies are expensive and time consuming. Benefit transfer provides an alternative approach to determine if it is worth conducting further investigations. The lessons drawn from this study can also inform assessments of other natural hazards.
The authors acknowledge the Bushfire and Natural Hazards CRC for funding this research. They also thank the editor and the two anonymous reviewers for their insightful comments that greatly improved the manuscript.
BHKC Project Steering Group (BHKCP) 2016, Brown Hill Keswick Creek catchment- Stormwater management plan. Adelaide, South Australia, Australia: Report prepared for the Cities of Adelaide, Burnside, Mitcham, Unley and West Torrens.
Chalak M, Florec V, Hailu A, Gibson FL & Pannell DJ 2017, Integrating non-market values in economic analyses of flood mitigation: a case study of the Brown Hill and Keswick creeks catchment in Adelaide. Working Paper 1702, Agricultural and Resource Economics, University of Western Australia, Crawley, Australia.
Environment Agency and DEFRA (DEFRA/EA) 2005, The appraisal of human related intangible impacts of flooding. Joint Defra/EA Flood and Coastal Erosion Risk Management R&D Programme. R&D Technical Report FD2005/TR. London, UK: DEFRA Flood Management Division.
Hammond MJ, Chen AS, Djordjević S, Butler D & Mark O 2015, Urban flood impact assessment: A state-of-the-art review. Urban Water Journal, vol. 12, pp. 14-29.
Hansson K, Danielson M & Ekenberg L 2008, A framework for evaluation of flood management strategies. Journal of Environmental Management, vol. 86, pp. 465-480.
Johnston RJ, Rosenberger R & Rolfe J 2015, Benefit Transfer of Environmental and Resource Values: A Guide for Researchers and Practitioners, Dordrecht, Netherlands, Springer.
Joseph R, Proverbs D & Lamond J 2015, Assessing the value of intangible benefits of property level flood risk adaptation (PLFRA) measures. Natural Hazards, vol. 79, pp. 1275-1297.
Owusu S, Wright G & Arthur S 2015, Public attitudes towards flooding and property-level flood protection measures. Natural Hazards, vol. 77, pp. 1963-1978.
Pannell DJ & Gibson FL 2016, Environmental cost of using poor decision metrics to prioritize environmental projects. Conservation Biology, vol. 30, pp. 382-391.
Dr Veronique Florec is a Research Associate at the University of Western Australia. Her research focuses on improving the management of the natural environment through multidisciplinary projects that combine social, environmental and economic information. She currently leads a project investigating the economics of natural hazards.
Dr Morteza Chalak has a PhD in Environmental Economics. He was a Research Assistant Professor at the University of Western Australia until 2017. His research focused on improving decision-making for the management of the environment, agriculture and natural resources. He is now with the Victorian Department of Treasury and Finance.
Associate Professor Atakelty Hailu is at the University of Western Australia. His research includes efficiency and productivity analysis, whole-farm bioeconomic modelling, environmental policy design and agent-based computational economics.
1 Other methods exist for estimating WTP for intangible assets based on observations of existing markets, but these are also resource intensive and require large amounts of data. If intangible assets are not measured in dollar values (WTP), they cannot be fully integrated in BCAs.