By Pablo Suarez, Associate Director for Research and Innovation, Red Cross Red Crescent Climate Centre
How can we help people and organisations experience the humanitarian consequences of climate change and extreme events? The Red Cross Red Crescent Climate Centre has worked with partners to explore virtual reality (VR) to blend playful interactivity with innovative approaches to data visualisation for risk management.
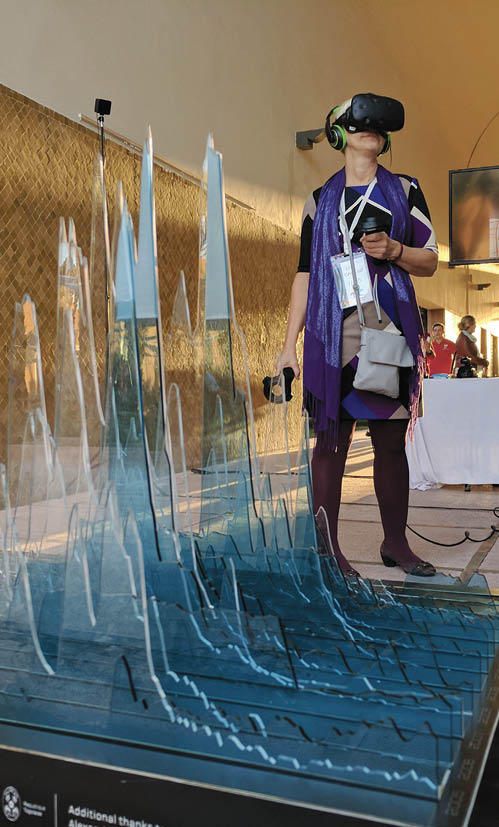
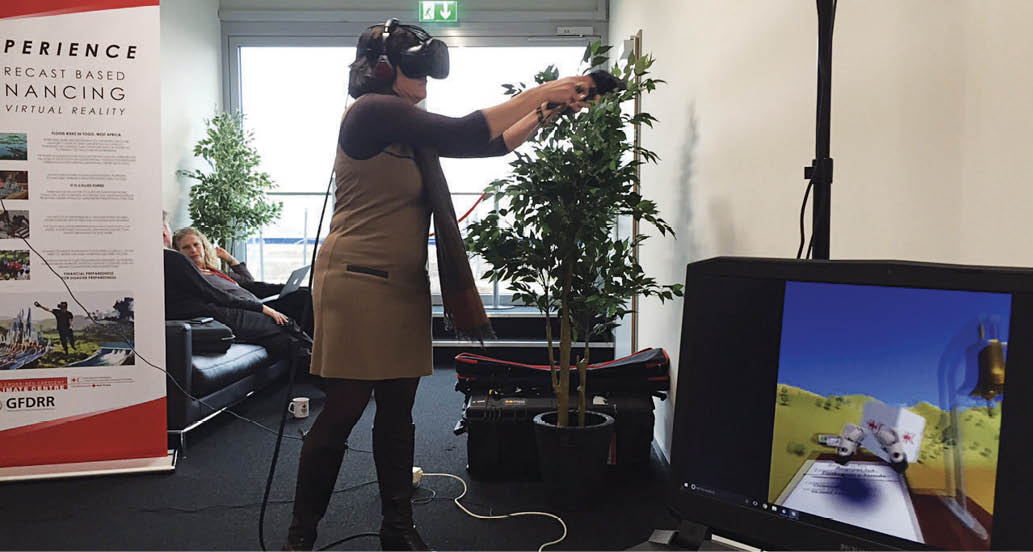
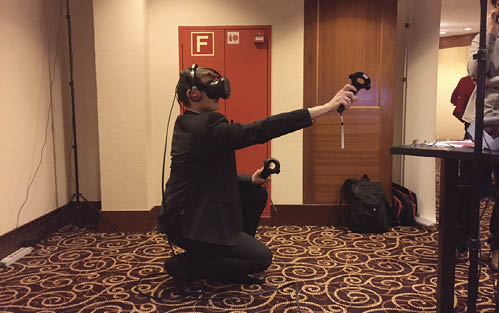
Imagine you are attending the United Nations Climate Conference in Marrakech, Morocco. Most information about changing climate risks put you, as the audience, in a passive mode, whether via narrative form (text and audio) or via two-dimensional visual interfaces (such as maps and graphs on paper or a flat screen). Now imagine you can try something different. Your full body becomes integral to the intellectual process of understanding and using data. Your body becomes the interface; linking science to decisions through a memorable, immersive experience in virtual reality.
Through VR, you, like hundreds of other participants from around the world, have serious fun while confronting two tasks: predicting Arctic sea ice volume for the coming decades, and managing flood operations through forecast-based financing downstream of a dam in the West African nation of Togo.
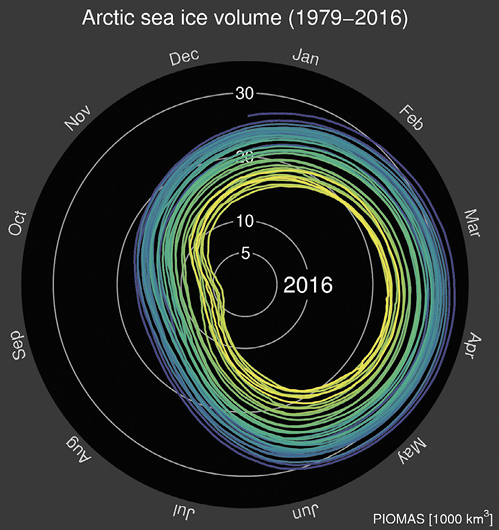
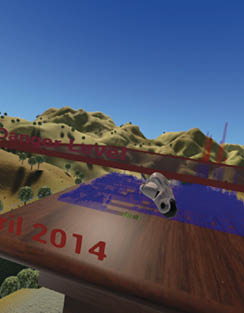
In the first experience, you are invited to depict the likely future of our changing planet. VR goggles take you near the North Pole. A 3D graph takes shape, spiraling in front of you at floor level depicting sea ice volume throughout 1980. You notice Arctic sea ice reaches its maximum around April, and its minimum in September. As darkness takes over the Arctic the simulation continues with additional years spiraling upward until pausing near the present, at about chest level. Over 35 years of changing sea ice, the volume on the first of September has dwindled from about 15,000 cubic kilometres in 1980 to less than 5000 in 2016.
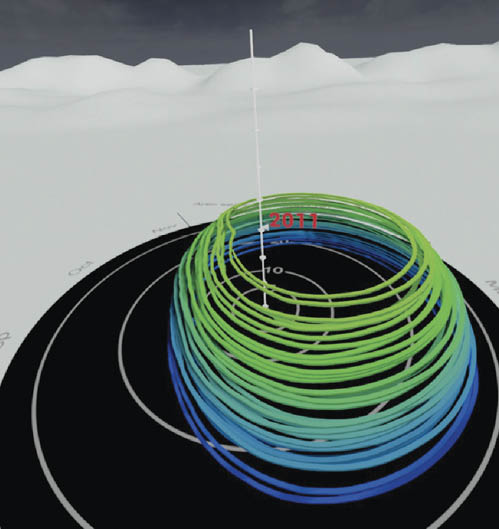
Viewed from above, projected on a flat surface, the graph looks like Figure 1. But when fully immersed in this virtual reality space, you experience the three-dimensional data visualisation in a very different way; walking around it or even through it, examining patterns from different angles, literally inhabiting the data environment (Figure 2). Global warming becomes palpable. You wonder, what should we expect for the coming decades?
The VR voiceover explains that you are holding an unusual paint brush. If you push the button while you move or rotate, your eyes will see what your brush creates, painting with light in the virtual reality space.
You are invited to ‘paint the future’ of the Arctic. How will sea ice evolve?
Your task is to create a visual depiction of data for another 35 years. The year 2050 is depicted as a semi-transparent horizontal plane above your head. Will there be Arctic sea ice in September 2050? If so, how much? If not, when exactly do you anticipate the data will show zero ice? Not an easy decision. You use your body to reach up to the future and physically place the exact VR location of the amount of ice by the middle of the century, or the timing of its end; likely in your lifetime. You wonder, will we witness our planet without Arctic sea ice?
Like many participants, you may find that engaging in this data-informed, artistic depiction of the future can lead to an ‘A-ha’ moment of understanding the serious, and potentially imminent, nature of the system-wide change occurring in our global climate.
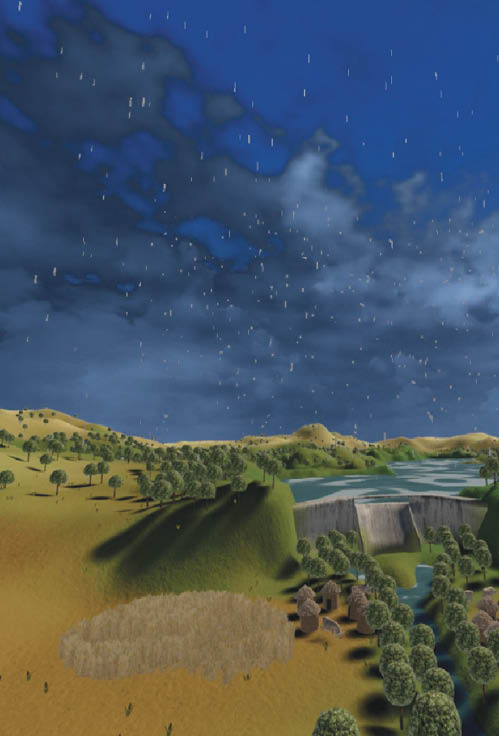
In the second VR experience you become a Red Cross worker in the Mono River Basin, downstream of Togo’s Nangbéto hydropower dam. If flooding occurs, you must mobilise your team and deliver humanitarian aid. Almost a decade of virtual disaster management experience is delivered in just a few minutes, with real-world data depicted for rainfall, dam reservoir levels, overspills, and floods. Every few years, you witness excessive rains that fill the reservoir beyond its capacity. Whenever this happens, dam operators must release water to prevent the structure from breaking. The rapid inundation that follows the spillage threatens the villages in the floodplain downstream.
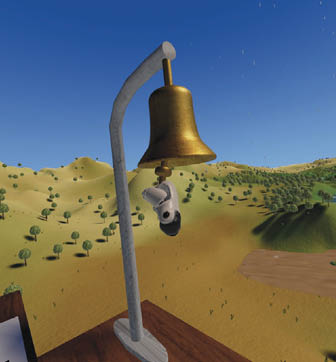
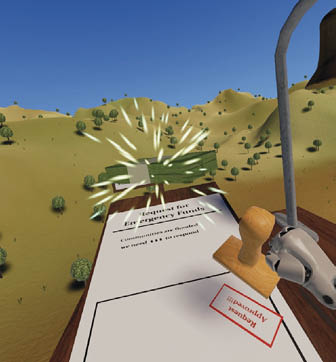
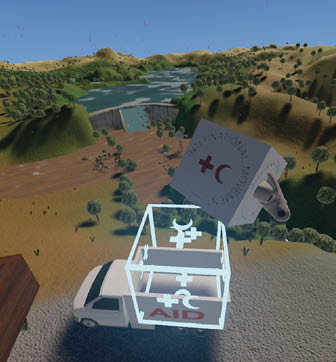
When flooding hits, the voiceover tells you: ‘Quick! Ring the bell to call the attention of your disaster management team. It’s time to help the inundated communities!’ You must physically shake the virtual bell with your real hands. Immediately a vehicle arrives, ready to deploy relief items. But the truck is empty: money is needed to help. Your next task is to stamp the emergency funding request. When the money finally arrives and procurement is completed, you pick up the virtual boxes with relief items and load them on the truck, which in turn drives to the affected villages. Delays are likely, even inevitable. As is often the case in the real world, communities receive assistance weeks or even months after an extreme event hits.
You notice a link between rainfall intensity, water levels in the dam, and timing of overspill, but what can you do with such knowledge when funds are only available after the flood? At this time you learn that there’s a better way to manage this flood risk. It’s less expensive and less time intensive. The approach is forecast-based financing1 for disaster preparedness. In essence this is financial preparedness for disaster preparedness.
You learn that in Togo, the Red Cross and its partners have developed an innovative self-learning algorithm to trigger early action based on a warning of flood risk. Your next VR task is to set up this system. You must pre-stamp a revised funding request so that when the forecast indicates a river flow in excess of your danger level, the system will automatically activate and fund your team’s work. A Data Sculpture evolves in front of you, depicting river flow over time including peaks associated with previous flood impacts. To define the danger level you must move a virtual plane that indicates the amount of river flow that is deemed too much, thus becoming the trigger for financing disaster preparedness activities.
In the last simulated year, as was the case in the real world in September 2016, forecast-based financing triggers funding for early action measures, just days before flooding hits villages along the Mono River. In 2010, it took 34 days from dam overspill to emergency funding release2.
__vs__2016_(FbF).jpg)
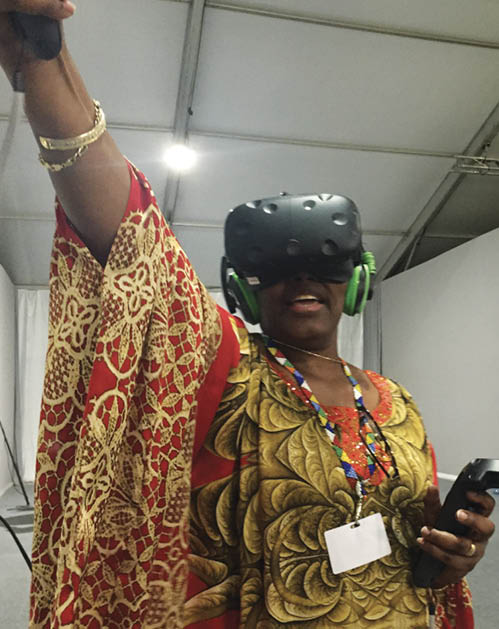
These two virtual reality experiences have enabled hundreds of participants to explore how science and finance can work in alliance to act faster and avert disasters. VR helps participants to envision the magnitude and implications of the changing global climate. This innovation3 is traveling to events worldwide, offering discovery and inspiration. The remarkable possibilities offered by this rapidly evolving, and increasingly affordable, VR technology merits additional exploration by humanitarian and development organisations interested in new learning and dialogue modalities for disaster management.
The virtual reality experiences described in this article were co-designed with James Morgan and developed by VISYON Digital Services, with support from the Global Facility for Disaster Reduction and Recovery. Additional support provided by Frank Antonelli, Janot Mendler de Suarez, Julie Arrighi, Regie Gibson, the German Red Cross and the Development and Climate Days at UNFCCC COP.
1 Coughlan de Perez E, van den Hurk B, van Aalst M, Jongman B, Klose T & Suarez P 2015, Forecast-based financing: an approach for catalyzing humanitarian action based on extreme weather and climate forecasts. Natural Hazards and Earth System Science vol. 15, no. 4, pp. 895-904.
2 Reuters AlertNet 2016, Virtual reality puts players in driving seat on disaster. At: www.climatecentre.org/news/798/at-d-c-days-virtual-reality-puts-players-in-driving-seat-on-disaster.
3 For more information, see www.climatecentre.org/vr.