Impact-to-Life (ITL) is defined as the aggregate consequence of the lack of availability of resources on the lives of people experiencing a disaster. Minimising the ITL for recovery efforts is based on the immediate availability of resources such as water, food, shelter, transportation, medical care, sandbags and bleach. Distributing resources in a timely manner significantly reduces the threat to life and property damage.
This research introduces a method for balancing assistance among local public, private and government sectors. This can bridge the gap in identification of limited and abundant resources, thereby allowing other stakeholders a way to pre-plan the efficient distribution of needed supplies. This study used a dataset from Hurricane Floyd for 10 counties in the State of North Carolina as a scenario for inputs into the BRAM.
Enhancements in satellite imaging technology and refinements in meteorological simulation models provide experts with better tracking capability and allows them to predict the impact path of a hurricane. Nonetheless, despite forewarnings, significant challenges exist in the determination of the optimal allocation of resources both before and after a disaster in order to mitigate its impact (Maon 2009). Resource availability is either abundant or lacking and communication among public, private and government sectors can be hampered.
For example, in North Carolina during and after Hurricane Floyd in 1999, resources were not readily available for public distribution. This was attributed to the use of outdated map data for flood zone areas prior to Hurricane Floyd’s impact (NOAA 2009). Seventy-five per cent of North Carolina’s Flood Insurance Rate Maps were as old as five years (NOAA 2009). The use of these maps misled vendors to pick up supplies at wrong locations and resulted in significant delays in resource allocation. As a consequence the Federal Emergency Management Agency (FEMA) rigorously tailored the National Preparedness System documentation for multiple states, as well as for the District of Columbia and U.S. dependencies (Homeland Security 2011).
Good emergency preparation minimises ITL. In addition, adequate contingency planning is necessary to execute efficient resource allocation efforts. FEMA’s National Preparedness System outlines: ‘…an organised process for everyone in the whole community to move forward with their preparedness activities and achieve the National Preparedness Goal.’ (Homeland Security 2011). FEMA’s preparedness system provides a greater focus on procedures and guidelines in written form (FEMA 2008). This study focuses on developing contingency planning via mathematical models that provide solutions to resource allocation problems that can be used in real-time. For example, in the Hurricane Katrina After Action Report, survey respondents identified challenges in both location and facilitation of personnel procedures and a lack of effective coordination (Hoffman 2006).
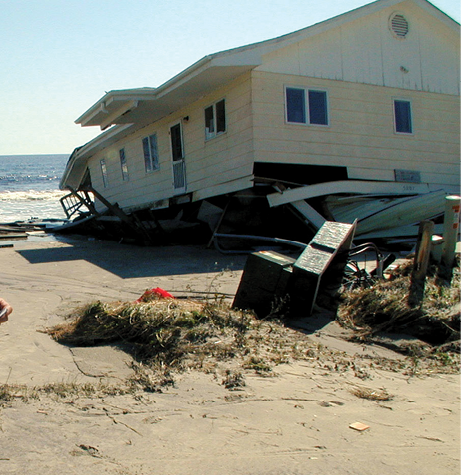
Long Beach, North Carolina 1999. The devastating storm surge that accompanied Hurricane Floyd damaged or destroyed hundreds of houses along the ocean front and flattened sand dunes.
Communication among internal or external sectors can be problematic because of the ‘complexity and criticality’ of organisations (Maiers, Reynolds & Haselkorn 2005). In addition, ‘education, preparedness and training issues’ still remain once the collaborative organisations are identified (Casey 2004). Emergency response budgets have decreased in certain areas. One example is the reduction in funding for the Centers for Disease Control and Prevention (CDC). Specifically, the Biodefense and Emergency Preparedness budget for 2014 lists USD $1.33 billion, which is a $48 million decrease from 2012 budget (Roos 2013). Furthermore, in some areas, food and other goods experienced price increases (Barbic 2015).
There are several disaster simulation applications similar to the BRAM; however the approach proposed here differs in several ways. The FEMA and the U.S. National Preparedness Directorate provide an inventory tool that is the Incident Resource Inventory System (IRIS). The IRIS is operated by the Preparedness-Technology, Analysis and Coordination Center. IRIS is an open source information resource allocation system and can share information with multiple agencies. The tool provides a variety of information to assist communities with resource availabilities. Some information includes disaster mission requirements, the availability of resources, and the associated delivery time. Unlike IRIS, BRAM uses an optimisation technique to balance resources among sectors using an optimisation technique commonly used in supply chain management.

Hurricane Floyd off the coast of the U.S. in September 1999.
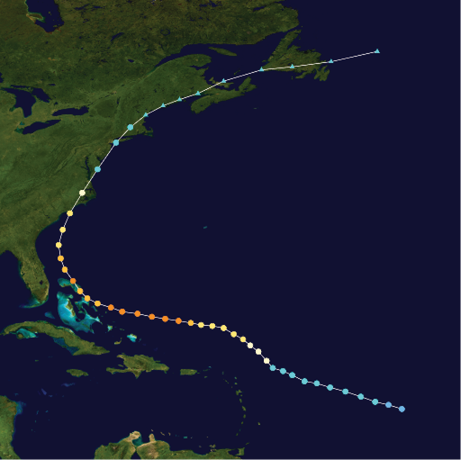
The track of Hurricane Floyd as it travels up the U.S. coast and intensifies.
Another disaster recovery system is the National Emergency Management Information System (NEMIS). The NEMIS system is used to connect communities with assistance after a disaster (FEMA 1998). Moline’s decision framework for disaster recovery centre resource allocation and identified post-disaster improvements (Moline 2014) was also evaluated. Moline’s approach is a data-driven technique for different types of resources using statistical analysis. The BRAM uses a mathematical optimisation approach. Other models studied were the Post-Disaster Needs Assessment (PDNA) and the Disaster Recovery Framework (DRF). The PDNA and DRF differ from the BRAM in that they identify processes and procedures for guiding multi-sector planning partnership (GFDRR 2014) while the BRAM focuses on the distribution of resources.
Communities engaged in disaster planning or recovery encounter different types of challenges. This requires collaboration of efforts for various hazards such as damage to levees (Galloway & Bronowicz 2006) and severely flooded counties, and for the distribution of resources to locations where they are needed most. In 2011, FEMA added new functions to the National Disaster Recovery Framework emphasising, ‘Long-term environmental and cultural resource recovery needs after large-scale and catastrophic incidents’ (Homeland Security 2011). This enhancement was introduced to solve cross-sector partnership problems by providing various levels of an organisation to share information and responsibility as necessary. Nevertheless, this new implementation is ‘context-based’ and lacks application mechanisms such as optimisation of resource allocation. In addition, the new implementation does not cover the contingency planning (‘pre-phase’) of multi-sector collaboration, or the lack of coverage, which is an important challenge in disaster planning. This paper provides a research model to solve this challenge.
This method provides an approach for solving resource allocation distributions while minimising ITL. Built into the approach is a way to systematically calculate resource allocation distributions. This study leveraged Baker’s presidential disaster analysis declarations map data, covering the 33-year period from January 1965 to December of 1998 where flooding represented 45 per cent of the disaster declarations, followed by numerous severe storms estimated at 15 per cent (Homeland Security 2011). From Baker’s analysis and data collected from Hurricane Floyd, several lessons were learned including the importance of digitising flood maps, identification of residential evacuation routes, and the creation of contingency planning mechanisms to identify resources. Lessons from Hurricane Floyd included the importance of updating flood maps and transformation of map data into a digital format allowing for easier identification of available evacuation routes for residences. This research shows that improved map preparation helps in the development of contingency planning mechanisms that assist to identify warehouse locations and potential cross-organisational collaboration. In this study, three organisations within various sectors were examined. These were the American Red Cross, Walmart, and the State of North Carolina Department of Public Safety Emergency Management. The study examined how resources are balanced among local public (American Red Cross), local private (Walmart), and local government (Department of Public Safety Emergency Management). Leveraging the application of the BRAM, it was hypothesised that the selected sectors and locations would significantly contribute to solving resource allocation challenges. The algorithms used in the input are flow-modeling techniques. This model focuses only on the ‘pre-phase’ of contingency planning and ignores the delivery time of resource distributions.
Figure 1 shows the use of the BRAM and the stepped approach to processing information.
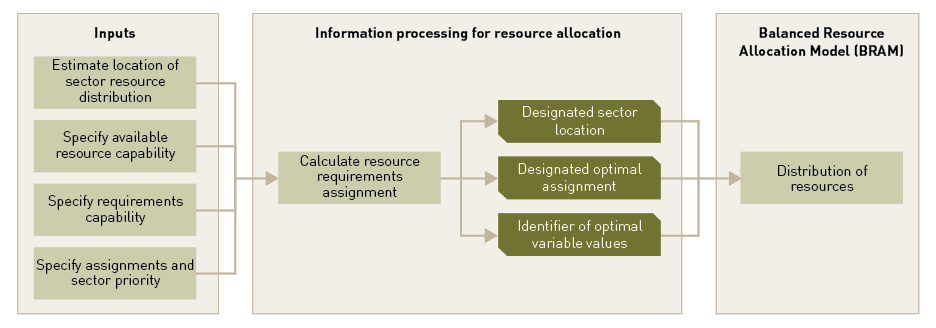
The first stage in applying the BRAM consists of a user organisation identifying the inputs. This provides the assumptions for the BRAM calculations. The ‘Estimate location of sector resource distribution’ step involves authorities identifying locations of designated distribution sites. The ‘Specify available resource capacity’ step identifies the inventory of resources at each organisation. The ‘Specify requirements capacity’ step identifies and manages requests from potential causalities. The ‘Specify assignments and sector priority’ step identifies organisational priorities in chronological order of availability.
The ‘Information processing distribution’ stage begins after the requirements and resource specifications are defined and collected in the ‘Input’ stage. The determination of resource assignments, designated sector location(s), designated optimal assignment(s), and identified optimal variable values are processed in the ‘Calculate requirement resource assignments’ module. The ‘Designated sector location’ step is processed after resource requirements calculations are completed and a distribution location is determined. The ‘Designated optimal assignment’ step is processed after resource requirements computations are completed and assignment combinations are created. The ‘Identified optimal variable values’ step is processed after resource requirements calculations are completed and priority variable values are chosen from the dataset. The ‘Distribution of resources’ step creates flows for resource distribution.
The scenario data used for this study was collected from Hurricane Floyd recovery efforts specifically, the resource quantities that were distributed to North Carolina communities. There were two scenarios in this research. Scenario one uses the BRAM, while scenario two is data from the actual distribution of resources. The evaluated counties are Beaufort, Brunswick, Camden, Carteret, Dare, Duplin, Hyde, Jones, Pender and Tyrrell. The evaluated resource types are blanket, bleach, comfort kit, cot, generator, packaged meal, plastic, sandbag, wash kit and water. The collaborating sectors are the local public sector (American Red Cross), local private sector (Walmart) and local government sector (State of North Carolina- Department of Public Safety Emergency Management).
The BRAM data, using American Red Cross as the local public sector, Walmart as the local private sector and the North Carolina Department of Public Safety Emergency Management as the local government sector in charge of distribution of the above commodities to the affected locations was applied to the Hurricane Floyd scenario with results summarised in Table 1. The cost structure is based on item costs and the model optimising the distribution costs.
Table 1: Potential costs savings with balanced resource allocation.
| Sector | Predicted Cost (BRAM) (USD) |
Actual Cost (USD) |
Potential Savings (USD) |
|---|---|---|---|
Public Sector |
$32 275 |
$461 353 |
$429 078 |
Private Sector |
$94 849 |
$562 369 |
$467 520 |
Government Sector |
$247 124 |
$357 429 |
$110 305 |
Total Cost |
$374 248 |
$1 381 151 |
$1 006 903 |
The total cost computed was USD $374 248 using all three sectors. Specifically, local public sector total is USD $32 275, local private sector total is USD $94 849 and local government sector total is USD $247 124. If each organisation handled resource distributions independently the total cost would be USD $461 353 for local public sector, USD $562 369 for local private sector and USD $357 429 for local government sector. The BRAM approach provided a potential 91 per cent, 83 per cent and 31 per cent in savings for local public, private and government sectors respectively. This indicates that, based on the choices of resources and locations, balancing among organisation one, two and three will be the most cost-effective option in minimising ITL. Had this model been available, the local government organisation would have conserved resources by collaborating with local private organisations to supply the majority of blankets to Beaufort County. In addition, the local government organisation may have conserved resources by coordinating with the local public organisation to supply some of the sandbags to Dare County. In some instances, partnership in support of regional and national disaster relief efforts evolves into multiple frameworks. Teamwork efforts are then distributed accordingly in order to operate successfully (Haimes et al. 2008). Moreover, corporate and nongovernment organisation partnerships demonstrate economic techniques by collaboration (Damlamian 2006). Partnerships among sectors would improve efficiency.
This research is based on the Hurricane Floyd dataset and annual reports from FEMA (Homeland Security 2011), State of North Carolina Department of Public Safety Emergency Management (Latham 2013), American Red Cross (American Red Cross 1999), Walmart (Harvey 1999), the Census Bureau (NC Home Town Locator 2014) and the National Oceanic and Atmospheric Administration (NOAA 2009). This assumes that all sectors could outsource to other vendors to fulfil required needs. Additionally, this study presumes that people at designated resource locations (i.e. depots) will distribute the goods to local communities accordingly. The collection of data includes the amount of resources requested and distributed, resource type, and associated costs during Hurricane Floyd.
These allocation assumptions would be stressed if there was a need to support several emergencies within a short time period. This study offers a collaboration technique that emphasises depleting resources during hurricane recoveries within communities. Moreover, it saves money and resources. The model showed that the State of North Carolina could have saved some of its resources during the hurricane recovery efforts. Although this research focused on the ‘pre-phase’ of Hurricane Floyd, the formulation can be used to suit other disaster types as well as other phases of an event. It is recommended that future investigations alter the formula and introduce applicable data for other kinds of catastrophes such as earthquakes, tornados, typhoons, snowstorms, mudslides, floods and fires. In addition, the model is transferable to suit other government agencies, public and private organisations and events in other countries.
In order to minimise ITL and improve contingency plans for future emergency efforts, it is important to become familiar with the various resource locations. Collaboration between local public, private and government sectors is an essential part of preparing for recovery efforts. While implementing an integrated contingency plan adopted by various sectors can be cumbersome, each phase of a relief effort is critical. In this case the complexity could be limited if the appropriate team is formed and a frequent and consistent dialogue between all sectors is arranged. FEMA’s National Preparedness System, part four, is most relevant to this research area. Further upgrades and enhancements will improve current attributes and contribute to achieving the U.S. National Preparedness Goal1.
The BRAM introduces a methodology for modeling the necessary resources that need distribution during and after an emergency event. Hurricane Floyd is only one scenario that demonstrates the model’s utility. The model can be adapted to suit severe hurricanes and cyclones (category 1-5) by changing the input data. One of the model’s limitations is the delivery time. This study focuses on contingency planning ‘pre-phase’ of hurricane response and did not evaluate delivery time that is usually identified in the ‘during phase.’ Although the model can be used to analyse all phases, phase-dependent alterations are required for each specific phase. This research indicates that appropriate contingency planning and knowledge of available resources will minimise the ITL.
The authors are obligated to the reviewers of this paper for their insightfulness.
American Red Cross 1999, Recovery Efforts from Hurricane Floyd, report, American Red Cross Resources, September.
Barbic K 2015, Farm Bureau Survey Shows Modest Increase in Food Prices, Newsline, The Voice of Agriculture.
Casey M 2004, Tsunami Warnings Too Little, Too Late, Seattle Times, 28 December.
Damlamian C 2006, Corporate-NGO Partnerships for Sustainable Development: How Corporations and Nongovernmental Organisations can Work Together, University of Pennsylvania Scholarly Commons.
FEMA 1998, NEMIS Concept of Operations, report, FEMA Information Technology Services Directorate Operations Division, 15 May.
FEMA 2008, FEMA Strategic Plan: Fiscal Years 2008-2013, report. The Nation’s Preeminent Emergency Management and Preparedness Agency, FEMA p. 422, January.
Galloway G & Bronowicz K 2006, The National Levee Challenge: Levees and the FEMA Flood Map Modernization Initiative, report, Interagency Levee Policy Review Committee, Washington, DC, 1 September.
Global Facility for Disaster Reduction and Recovery (GFDRR) 2014, Developing Disaster Recovery Frameworks, World Reconstruction Conference Version, September.
Haimes YY, Crowther K & Horowitz BM 2008, Homeland Security Preparedness: Balancing Protection with Resilience in Emergent Systems, Systems Engineering, pp. 11:287-308.
Harvey P 1999, Walmart 1999 Annual Report, 26 October 1999, pp 4-6.
Hoffman H 2006, Hurricane Katrina After Action Report and Recommendations, report, Emergency Support Function 8 Health & Medical State of Mississippi, North Carolina, 1 June.
Homeland Security 2011, National Preparedness System, report, Homeland Security, November.
Latham P 2013, Hurricane Floyd Dataset, working papers, NC Department of Public Safety Emergency Management, North Carolina, 13 November.
Leaning J & Debarati GS 2013, Natural disasters, armed conflict, and public health, New England Journal of Medicine 369, pp. 19:1836-1842.
Maiers C, Reynolds M & Haselkorn M 2005, Challenges to Effective Information and Communication Systems in Humanitarian Relief Organisations, IEEE International Professional Communication Conference Proceedings.
Maon F 2009, Developing supply chains in disaster relief operations through cross-sector socially oriented collaborations: a theoretical model, Supply chain management, vol. 14 (2), pp. 149-64.
Moline JN 2014, Data-driven resource allocation decisions: FEMA’s disaster recovery centers, Master’s Thesis, MIT.
NC Home Town Locator 2014, North Carolina Census Data. At: http://northcarolina.hometownlocator.com [23 January 2014].
NOAA National Weather Service 1999, Hurricane Floyd Storm Summary. Newport/Morehead.
NOAA 2009, Floyd Remember: Flood Awareness Week Greenville, report, North Carolina Floodplain Mapping Program, 18 March.
Park T & Serino R 2013, Innovating to Improve Disaster Response and Recovery, policy brief, Office of Science and Technology Policy, 3 September.
Roos R 2013, CDC Preparedness funds take hit in proposed 2014 Budget, CIDRAP News, 10 April.
Jessica Donaldson is a Ronald E. McNair Scholar and holds a B.Sc. in Mathematics from SUNY Old Westbury. Jessica is a System Engineering doctoral student at The George Washington University.
Dr Enrique Campos-Náñez is a Director of Modeling and Simulation at The Epsilon Group where he is in charge of development of software for pharmacokinetics. He lectures on system dynamics, modeling and optimisation.
Dr Thomas A. Mazzuchi is Professor of Engineering Management and Systems Engineering at The George Washington University. His research interests include reliability, life testing design and inference, maintenance inspection policy analysis, and expert judgment in risk analysis.
Dr Shahram Sarkani is Professor of Engineering Management and Systems Engineering, and Director of EMSE Off-Campus Programs at The George Washington University.
1 U.S. National Preparedness Goal. At: www.fema.gov/national-preparedness-goal.