A version of this paper was presented at the Australia & New Zealand Disaster and Emergency Management Conference in May 2014.
The department’s Emergency Management Operations team is responsible for the organisation and management of the department’s resources for emergency preparedness and response. During emergency events intelligence gathering and situation reporting are key activities performed by the team. These activities are mostly manual and time consuming, and require the attention of several staff to obtain and assemble the required information into appropriate structures and formats to produce the situation report, or SitRep. Some of these tasks can be automated allowing emergency co-ordinators to better use their time in the analysis of information.
CSIRO has developed the ERIC tool in collaboration with the Emergency Management Operations team to automate some of the intelligence-gathering and situation reporting activities performed during emergency events.
ERIC is a web-based tool that demonstrates the usefulness of data integration for emergency managers. The tool integrates dynamic information from real-time web feeds with background static data to provide a national picture. A simplified version of the ERIC tool is publically available at http://eric.csiro.au/. This version demonstrates the benefits of data integration from numerous sources, but excludes data specifically relevant to the department and does not include SitRep features.
The ERIC project began in 2012 to explore the benefits of web-based mapping and data integration for the purpose of monitoring emergency events around the country. The project also demonstrated the benefits of the rapid collation of information from a wide collection of data sources into a single, concise situation report that would be suitable for senior managers to use when making informed decisions.
Major benefits:
ERIC has been in operation since January 2012. The primary interface is a map that allows users to navigate the information spatially. Figure 1 shows an example of the various weather and fire warnings in place at midday 23 February 2013 across Australia. While this information is reproduced from existing sources, the benefit ERIC offers is that it is available for the whole country at a single website and is available in a database so it can be reproduced when required.
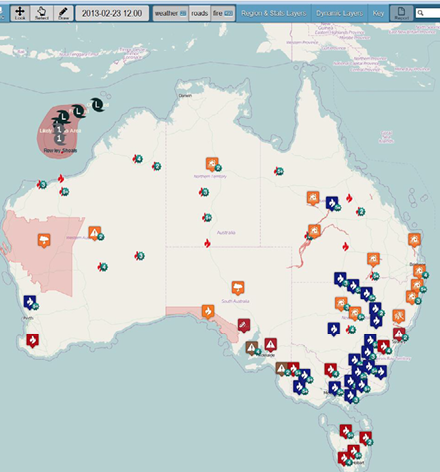
The icons used in Figure 1 depict numerous fire alerts, hotspots, Bureau of Meteorology weather warnings and the path and forecast category of Cyclone Rusty. Further information about the events is provided in a pop-up box by clicking on the icon. The ‘Key’ button defines what each icon means. The location of each icon is determined from the content of the web feed. In most cases, a specific co-ordinate is provided and sometimes a polygon region is described. This is the case for the warnings in South Australia and Western Australia, which are shown as the magenta regions. When a specific geographic region is not provided the icon is located in the centre of the state. The zoom level in Figure 1 results in nearby icons being aggregated and annotated with a number indicating how many icons are grouped together. This reduces the number of icons presented on the map to a visually manageable number.
The information available in ERIC can be accessed by panning and zooming the map to an area of interest, turning layers of information on or off, navigating to a specific day and time and clicking the map icons and regions to display further information. Figure 2 shows an example of the State Mine Fire in central NSW just before 1.30 pm on 21 October 2013. The extent of the fire is provided by the NSW RFS along with details of the fire that are available in a pop-up. Also shown are the satellite hotspots from Geoscience Australia. The current fire front can be seen when viewed alongside the reported burn extent of the fire.
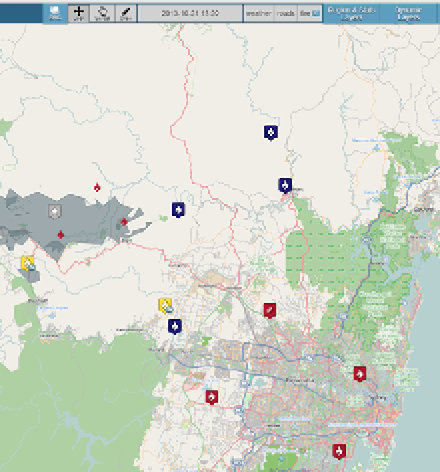
When zooming the map, as the zoom level passes predefined levels, new geographic layers of information become accessible to the user. These layers can be enabled or disabled using the check boxes available in the ‘Region & Stats Layers’ tab. Access to the geographical layers is controlled in this way to avoid the map becoming too detailed where information cannot be easily seen. For example, the zoom level in Figure 1, which shows the whole of Australia, only allows large regions to be shown, such as state boundaries and federal electorates. As the zoom level is increased, as is the case in Figure 2, further information is visible, such as postcodes and suburbs. Note that the ‘mini map’ (bottom right corner of the ERIC screen) shows further context for the map region.
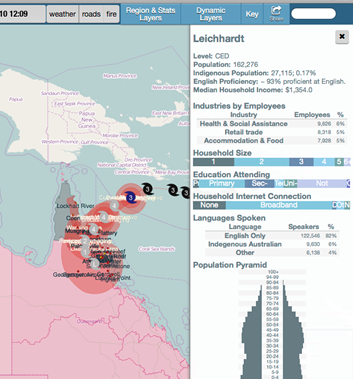
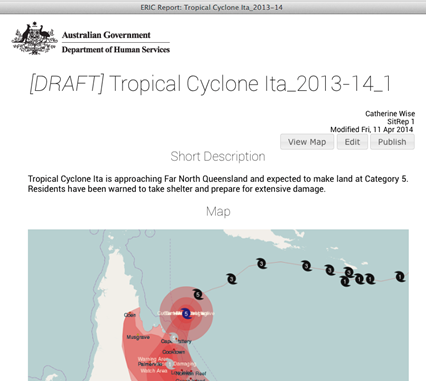
Figure 3 is an example of the ABS data available in ERIC that shows the anticipated path of Cyclone Ita as it approaches far north Queensland in April 2014. A summary of the 2011 ABS Census information for the federal electorate of Leichhardt is shown in the pop-up.
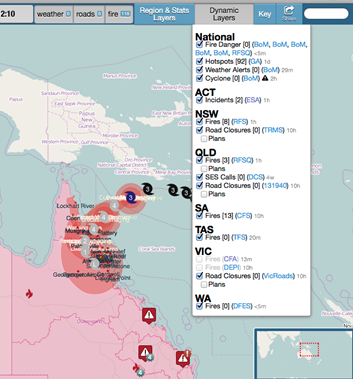
ERIC collects data from a variety of federal and state government information sources, including weather, fire, and road closures. The list of services includes the last time an update was seen, as well as how many events from that service are currently in the map view. An example of these features is shown in Figure 4.
The SitRep produced by the Emergency Management Operations team during an emergency, records information about all large-scale events around the country and the department’s operational response. The event details include what the events are, where they are located, and the impact to the department (sites and staff affected in the region). The response information summarises the role of the relevant state, territory or federal government (in terms of assistance available or provided) and the department (staff mobilised, the impact on business-as-usual, statistics about phone calls received and claims summary). These impacts are measured and reported on during the emergency in the SitRep.
The first SitRep usually takes the longest to prepare. It includes detailed information about the event, or events, to initially orientate the reader. Subsequent SitReps can be produced faster by starting with the previous SitRep and including the new information. This new information is highlighted, for example by marking up in italics, so the reader can quickly identify what the new information is. The reader is expected to have knowledge of the previous SitRep, however the reports include all the relevant information from the previous reports.
The structure of a SitRep is based on a template and describes the events displayed on the map interface. To create a SitRep the user navigates the map to the area of interest, defines a region to be reported on (in terms of demographic information) such as a local government area or postcode, then creates a preliminary SitRep using the ‘Report’ button. The result of doing this for the region shown in Figure 4 can be seen in Figure 5. Note the report was made on the following day, Friday 11 April, as the cyclone was approaching landfall near Cooktown.
This preliminary report is populated with demographic information that was available in the map interface, including a copy of the map, and allows the user to optionally include details of relevance for the report being created. Note that most of the content of the report in Figure 5 cannot be shown due to the length of the generated form.
When the ERIC user is satisfied with the report they can publish it. The report is saved and can be viewed with its own link, but not edited. PDF and plain text versions are also generated for sharing via email. A full list of all reports saved, with their authors and dates, is available. From there the three versions, HTML, PDF and plain text, can be accessed.
The first use of ERIC by the department was over the Australian summer of 2012-2013. The SitRep features were not fully implemented at the time however effort was made to fully implement the work practices of the Emergency Management Operations team. Specifically, the reports originally generated by ERIC corresponded to a single event only. Over a disaster season different events at different locations need to be reported in the same SitRep. Also, the name of the report reflects the current emergency situation and needs to change over time, while being noted as part of the same ‘group’ or collection of situation reports.
These issues were addressed and ERIC SitReps now follow a workflow where ‘mini’ SitReps may be produced for a single disaster event at a specific location affecting a community. One or more mini SitReps may be combined to form a single SitRep that describes both the combined impact to the department, in terms of the response they are actively providing, and details of the individual events occurring around the country.
This workflow allows for greater flexibility in allocating people to create and edit the reports, or approve them for publication. Each report can be created or edited by different people, so the people involved in handling an event can produce the corresponding mini report, while those responsible for higher-level reports can produce the combined SitRep. Decomposing the reporting workflow in this way allows for the mini reports to be useful in their own right as standalone reports on specific events, as well as forming the building blocks for combined SitReps. The system manages the report life cycle, and could be configured to support the allocation of specific roles and authorisations to users. It also tracks the life cycle of events, allowing users to create new reports (mini or SitRep) about an event by starting with, and automatically updating where possible, the previous report from that sequence.
ERIC continues to be tested by the department during emergency events. The process of creating, saving, publishing and distributing situation reports using ERIC is the current focus of testing and evaluation to ensure it meets the needs of the department’s Emergency Management Operations team. This includes consultation with the report consumers: the senior executive decision-makers within the department.
When ERIC is used to manage the publication of situation reports, the repository of reports and the information they contain may provide insights on the department’s response activities over the course of an emergency event. Examples include the call volumes relating to an event, the deployed Point of Presence, number of staff attending evacuation and recovery centres, claims made and total payments. This information could be analysed (correlated and plotted) and used as evidence for predictive modelling of expected behaviour for future events. For example, during an emergency, the historical record could be used in conjunction with the current data for a specific event to predict what the expected call volume and payment rate will be for the next day.
Social media is playing an increasingly important role within communities. Chatfield, Scholl & Brajawidagda (2014) describe how government engaged citizens interacted through social media during and in the aftermath of the Hurricane Sandy emergency event and highlights the potential benefits for governments and affected communities. In a recent study Power, Robinson & Wise (2013b), information ERIC retrieved via web feeds about a significant fire emergency in Australia was compared with tweets about the same emergency. It showed that information was published on Twitter prior to the web feed, it contained more specific incident information, was updated more frequently, included information from the public as well as official sources, and was available after the web feed contents were removed. Anderson (2012) discusses the challenges emergency services organisations face when dealing with social media as not only a new source of information but also a new avenue to distribute timely information to the public. It is expected that the automatic integration of both crowd sourced and official social media information about ongoing emergency events into the ERIC tool will improve its situation awareness capabilities. This will present many research challenges such as how to identify social media posts that are relevant to particular events and filter out the large quantity of irrelevant data (Imran et al. 2014) and how to geo-locate the social media posts (Middleton, Middleton & Modafferi 2014).
CSIRO has developed a web-based tool to demonstrate the usefulness of data integration for emergency managers. The tool combines information from real-time web feeds with demographics data to provide a national picture that is available for historical review. The tool can identify and notify users when the current situation changes and supports the intelligence gathering and situation reporting activities performed by, in this instance, the Australian Government Department of Human Services during emergency events.
A public version of the ERIC tool was developed (available at http://eric.csiro.au/) with the aim of promoting it to the emergency management community in Australia. All departmental information has been removed from the public version of the tool and the situation reporting features disabled. However, the public tool still demonstrates the utility of data integration for the purposes of emergency management.
The current phase of work has refined the generation and management of situation reports. This task is one of the main activities performed by the Emergency Management Operations team during emergency events and improvements will provide more ‘think’ time to analyse the intelligence being gathered. The situation reporting features of the ERIC tool are being refined in preparation for the next Australian disaster season.
The ERIC project aligns with the CSIRO research capabilities of disaster management. While the ERIC tool was developed for a specific user group there are opportunities to broaden the tasks achievable using ERIC by extending the functions it can perform and to include new data items, for example historical event information and crowd sourced social media. This can be achieved by leveraging the experience gained in the Pilot Impacts Portal (Power et al. 2013a) and using the CSIRO Emergency Situational Awareness platform (Yin et al. 2012).
This research was funded under the Human Services Delivery Research Alliance between the CSIRO and the Australian Government Department of Human Services.
Anderson M 2012, Integrating social media into traditional emergency management command and control structures: the square peg into the round hole? Disaster and Emergency Management Conference Proceedings, 16-18 April 2012. Brisbane, Australia, pp. 18-34.
Chatfield AT, Scholl HJ & Brajawidagda U 2014, # Sandy Tweets: Citizens’ Co-Production of Time-Critical Information during an Unfolding Catastrophe. 47th Hawaii International Conference on System Science, January 2014, pp. 1947-1957.
Imran M, Castillo C, Lucas J, Meier P & Rogstadius J 2014, Coordinating Human and Machine Intelligence to Classify Microblog Communications in Crises. Proceedings of the 11th International ISCRAM Conference, May 2014. Pennsylvania, USA.
Middleton S, Middleton L & Modafferi S 2014, Real-time Crisis Mapping of Natural Disasters using Social Media. IEEE Intelligent Systems, vol. 29, no. 2, pp. 9-17.
Power R, Robinson B, Cameron M, Nicolopoulos N 2013a, The Pilot Impacts Portal: experience in building an emergency management information sharing tool. Australian Journal of Emergency Management, vol. 28, no. 4, pp. 20-28.
Power R, Robinson B & Wise C 2013b, Comparing Web Feeds and Tweets for Emergency Management. Social Web for Disaster Management Workshop 2013. WWW 2013 Companion, May 13–17, 2013. Rio de Janeiro, Brazil, pp. 1007-1010.
Yin J, Lampert A, Cameron M, Robinson B & Power R 2012, Using Social Media to Enhance Emergency Situation Awareness, IEEE Intelligent Systems, vol. 27, no. 6, pp. 52-59.
Robert Power is a research team leader who has been with CSIRO for over 20 years. He is currently investigating the use of social networks to aid emergency management, web interfaces to support disaster planning, and issues of data integration.
Michael Compton was a research scientist and has been with CSIRO for 14 years. He is currently researching semantics for emergency management, operations reasoning, provenance and sensor networks.
David Ratcliffe has been a software engineer with CSIRO for 10 years. He is currently pursuing a PhD with the Australian National University with a focus on data mining methods for the Semantic Web.
Bella Robinson is a senior software engineer who has been with CSIRO for 18 years. Her areas of interest include spatial information systems, web applications, and social media analysis.
Geoff Squire is a senior software engineer who has been with CSIRO for over 13 years. He is interested in the use of web technologies, semantic technologies and linked open data for discovering, exploring and integrating data and services.
Catherine Wise was a CSIRO software engineer working on projects researching cloud computing, geographic data aggregation, and web user experience optimisation.
John Dickinson was the Director of Emergency Management for the Australian Government Department of Human Services who was with the department for over 18 years.
Lucy Knight is the Assistant Director of Emergency Management for the Australian Government Department of Human Services and has been with the department for over 10 years.