Disaster resilience has been positioned as a key strategic goal for governments, non- government organisations, communities and individuals in Australia. In 2010, the Council of Australian Governments (COAG) adopted a whole-of-nation resilience approach to disaster management. The National Strategy for Disaster Resilience (Australian Government 2011) broadly outlines how Australia should aim to achieve this vision, emphasising the role of society as a whole in shaping a resilient future.
Government and non-government organisations at various geographic scales share a need to monitor a community’s ability to prepare, mitigate, respond and recover from disasters, in order to identify vulnerabilities and strengths. These assessments provide opportunities to enact alternative plans or locate alternative resources if required (O’Jenkins 2011). As such, several tools have been developed to assess the disaster resilience of communities (Shaw et al. 2010, Cutter et al. 2010, Cohen et al. 2013). To date there has been limited evaluation of these tools and it is not clear how valid they are for communities of different sizes and cultures. Similarly, a community scoring well on an assessment of resilience has not been shown to recover from disasters quicker or easier than a community receiving a lower score. In this regard, an assessment of resilience by any of the assessment tools is still a conceptual exercise.
Participatory methods of community development have been widely promoted by both academic and governmental epistemic communities (Arnstein 1969, Paton 2006, Australian Government 2014) to facilitate social learning and social change at the local scale. In viewing community resilience as a transformative and adaptive process (Chandler 2012), dimensions of adaptive capacity, self-organisation and self-securing agency emerge (Walker & Salt 2006, Frazier et al. 2013). It is therefore appropriate that methods of assessing a community’s disaster resilience be placed at the local scale, enabling local actors to build and enhance their own resilience. This is in keeping with the climate change adaptation literature, which emphasises that a more integrated view of climate change-related impacts, vulnerabilities and opportunities consists of responses to place-based impacts (Rodima-Taylor et al. 2012). This approach is cognisant of local cultural practices, local knowledge and the divergent interests or values within a community (Romero-Lankao 2007, Vugteveen et al. 2010, Eriksen & Brown 2011), emphasising the role of local community members in determining these responses. Others consider that levels of resilience vary across a community therefore a local scale assessment that considers place-specific characteristics in addition to spatial dependencies with other places and regions is the most appropriate spatial unit for assessment tools (Cutter et al. 2008, Frazier et al. 2010). For these reasons, it is clear that an assessment of disaster resilience is appropriately undertaken at the local scale with the participation of local actors.
It is from this perspective that this assessment of five small rural communities on the Sunshine Coast as they apply the Community Disaster Resilience Scorecard Toolkit (see Arbon 2014), herein referred to as the Scorecard, is presented. The Scorecard was chosen principally for its participatory methodology that facilitates a local community to undertake its own assessment.
The primary aim of the Scorecard is to support community-based assessments of resilience to all hazards using a participatory methodology. The Scorecard is based upon the premise that all communities possess to `some extent, sets of physical, organisational and social capital, which are put into practise in the advent and recovery phase of a disaster’ (Arbon et al. 2012, p. 11). The Scorecard was piloted in four communities across Australia in both metropolitan and rural areas, some of which have experienced recent natural disasters (Arbon et al. 2012). This study adds to this sample by providing a small, rural community focus. Each of the Scorecard’s four components of community resilience is measured via a set of three to six indicators. Each indicator is assessed using a five-point scale. Points are awarded to each ranking so that a cumulative score for each component of resilience and a final score for all components can be calculated (see Table 1). Three ratings are assigned based on the score, which are:
Five sub-group communities were initially invited to participate in the research project. Each of the communities had formed a Local Disaster Management Sub-group which was facilitated and supported by the Sunshine Coast Regional Council prior to the commencement of this study. The process described by the Scorecard developers involves assembling a representative working party of between 10 to 15 members to meet three times over a period of four to six weeks (Torrens Research Institute 2012). While all of the sub-groups which were approached expressed an interest in participating in the project, all except one felt that requesting more than one meeting with community members was unrealistic. None of the sub-groups were confident that they could bring a dozen volunteers together to complete such a project. An alternative process was determined in consultation with the sub-group leaders to ensure maximum participation. One of the sub-groups could still not assemble team members to participate and did not continue with the research project. Another community joined one of the existing sub-groups and completed their own assessment concurrently.
The five participating communities were Kin Kin, Mooloolah Valley, Conondale, Crystal Waters and Cooran. In 2011, the five communities consisted of between 694 and 3 263 people. Kin Kin and Conondale have the smallest populations of 694 and 799 people respectively (ABS 2011). As reported in both the 2006 and 2011 census compilation, all of the communities have a median population age older than the Queensland and Australian averages. The rate of population increase between these census periods has been 6–7.5 per cent, which was significantly less than the Queensland growth rate. All of the participating communities reflect a more mature, smaller and settled population in comparison to the Queensland average. Additionally, the ABS statistics showed there is more ‘disadvantage’ in each of the towns with higher rates of unemployment and lower household incomes than both the Queensland and Australian averages, however there are greater rates of home ownership (ABS 2011).
Following an initial meeting with the research team, each sub-group nominated a research leader who liaised with the research team to distribute an information letter and the Scorecard indicators to the relevant members within their community. The participants were required to read the Scorecard and assess their community’s resilience individually. They were then required to attend one sub-group meeting and collectively work through the Scorecard to arrive at a group assessment of their community’s disaster resilience. The group assessment was based on consensus where more than 75 per cent of the participants agreed on the outcome. In situations where there were less than three people, all were required to agree on a ranking.
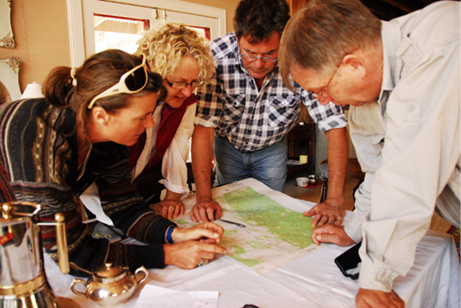
Image: NSW Office of Environment and Heritage,
Stuart Cohen
Involving community members in the determination of risk and emergency preparedness is part of the resilience assessment process.
As noted, the process adopted here is different to that prescribed by the Scorecard developers in regard to the proposed number of participants and meetings. Between two and seven people were present at each of the sub-group’s meetings, which were held in the early evenings with most participants attending after work. The average duration of the meetings spanned from one to three hours, with the average time being just over two hours. In contrast to the stipulations by the Scorecard developers, only one of the sub-groups felt that their community was fully represented by the participants. The other groups considered that rescheduling the meeting would not result in better representation. The lead author attended each meeting and manually recorded notes of the ensuing discussion. These notes were then combined with each sub-group’s assessment and are presented in this article.
Overall, the findings show that the community sub-group results were within the Scorecard `caution’ zone meaning that further investigation and monitoring is warranted to identify strategies to enhance the sub-group community’s disaster resilience. There is however, a substantial difference in the scores which may be indicative of the participants’ levels of knowledge of emergency management processes; or it may actually be indicative of each community’s diverse levels of disaster resilience, as intended. In discussing the results of the Scorecard all the participants felt that the final results were relatively accurate. Table 1 presents the sub-group scores for each indicator and the cumulative score of each of the key components. Review of this table with the actual Scorecard’s rankings provides a clearer picture of each sub-group’s responses.
Table 1: The participating sub-group’s scores and rating (red zone, caution or green zone).
|
Town (no. people in attendance) |
||||||
|---|---|---|---|---|---|---|
|
Indicator |
Mooloolah Valley |
Kin Kin |
Cooran |
Conondale |
Crystal Waters |
Average |
|
1. How connected are the members of your community? |
12 |
11.5 |
9 |
8 |
16 |
11.3 |
|
What proportion of your population is engaged with organisations? |
1 |
1.5 |
1 |
1 |
3 |
1.5 |
|
Do members of the community have access to a range of communication systems that allow information to flow during an emergency? |
3 |
2 |
2 |
2 |
3 |
2.4 |
|
What is the level of communication between local governing body and population? |
3 |
3 |
3 |
1 |
3 |
2.6 |
|
What is the relationship of your community with the larger region? |
3 |
3 |
2 |
3 |
3 |
2.8 |
|
What is the degree of connectedness across community groups? |
2 |
2 |
1 |
1 |
4 |
2 |
|
2. What is the level of risk and vulnerability in your community? |
18.5 |
24.5 |
18 |
21 |
24 |
23.15 |
|
What are the known risks of all identified hazards in your community? |
2 |
4 |
2 |
1 |
3 |
2.4 |
|
What are the trends in relative size of the permanent resident population and the daily population? |
2.5 |
2 |
2 |
5 |
5 |
3.3 |
|
What is the rate of the resident population change in the last 5 years? |
2 |
4 |
2 |
3 |
4 |
3 |
|
What proportion of the population has the capacity to independently move to safety? |
4 |
2 |
5 |
5 |
5 |
4.2 |
|
What proportion of the resident population prefers communication in a language other than English? |
5 |
5 |
5 |
5 |
5 |
5 |
|
Has the transient population (e.g., tourists, transient workers) been included in planning for response and recovery? |
1 |
3 |
2 |
2 |
2 |
2 |
|
What is the risk that your community could be isolated during an emergency event? |
2 |
4.5 |
n/a |
n/a |
n/a |
3.25 |
|
3. What procedures support community disaster planning, response and recovery? (rating) |
4 |
12 |
5.5 |
6 |
6.5 |
6.8 |
|
To what extent and level are households within the community engaged in planning for disaster response and recovery? |
1 |
3 |
2 |
3 |
2 |
2.2 |
|
Are there planned activities to reach the entire community about all-hazards resilience? |
1 |
5 |
1.5 |
1 |
1 |
1.9 |
|
Does the community actually meet requirements for disaster readiness? |
1 |
2 |
1 |
1 |
2 |
1.4 |
|
Do post-disaster event assessments change expectations or plans? |
1 |
2 |
1 |
1 |
1.5 |
1.3 |
|
4. What emergency planning, response and recovery resources are available in your community? (rating) |
11 |
17 |
12 |
13 |
17 |
14 |
|
How comprehensive is the local infrastructure emergency protection plan? |
2 |
2 |
3 |
3 |
3 |
2.6 |
|
What proportion of population with skills useful in emergency response/recovery can be mobilised if needed? |
2 |
1 |
1 |
1 |
4 |
1.8 |
|
To what extent are all educational institutions engaged in emergency preparedness education? |
1 |
4 |
2 |
2 |
2 |
2.2 |
|
How are available medical and public health services included in emergency planning? |
1 |
1 |
1 |
1 |
1 |
1 |
|
Are readily accessible locations available as evacuation or recovery centres and included in resilience strategy? |
2 |
5 |
2 |
2 |
3 |
2.8 |
|
What is the level of food/water/fuel readily availability in the community? |
3 |
4 |
3 |
4 |
4 |
3.6 |
|
TOTAL SCORE |
45.5 |
65 |
44.5 |
48 |
63.5 |
55.25 |
The communities that scored the lowest in this section were those with the highest participation levels of the sub-groups. The highest score for this section of the Scorecard was returned by Crystal Waters. This community has a unique community-orientated governance system, in which all residents are members of a body corporate and are required to participate in issues of governance.
Although all of the groups commented on how important connectedness is for enhancing disaster resilience, there were several alignment issues with the actual indicators. Some of the indicators were appropriate for larger communities in which cultural separation and language difficulties are more obvious. Despite these limitations, the sub-groups did discuss the current level of connectedness within their community. Some of the sub-groups discussed the separation between new residents moving into the area and those of the existing community. Many of the newer residents, particularly in Mooloolah Valley, commuted to Brisbane or elsewhere to work and were perceived by the sub-group to participate less in the local community.
In general, all of the sub-groups were concerned with communication systems as all had experienced power disruptions (for up to five days), and normally had patchy mobile reception or no reception at all. The reliance on internet and telephone modes of communication during an emergency or disaster was considered by the sub-groups to be inappropriate. Few members of the community were known to have satellite phones. Other communication options, such as community noticeboards, had been considered but safe access remained problematic.
Overall, these scores attracted a `caution’ rating from the Scorecard. As most of the communities refer to themselves as dormitory towns, where most people work outside of the town, many participants were concerned that if there was an emergency or disaster, there would not be help at hand. Similarly, many participants from across the sub-groups expressed concerns for new home builders who had gained development approval to build in flood-affected areas or in high bushfire-risk areas without understanding the risk of their new surroundings. The perception of many participants was that buildings were being approved in inappropriate areas.
The sub-groups that did the best in this section were those with members from volunteer emergency services groups. For example, the Local Action Plan, developed by the Queensland Fire and Rescue Service (QFRS) provides detailed information about risks and vulnerabilities within the Sunshine Coast communities. Accordingly, sub-groups with QFRS membership had a greater understanding of localised risks, and responses, as such they performed best in this section.
This section of the Scorecard highlights an area of apparent weakness for all of the sub-groups. Scores ranged from four to 12 out of a possible 15 points, with all communities, apart from Kin Kin, achieving a red-zone rating. Notably, two representatives from Kin Kin were involved in the QFRS and drew heavily from the Local Action Plan when responding to the Scorecard. Some of the indicators were found to be useful for highlighting deficiencies within the communities. For example, the post-disaster event assessment information was an area that three of the sub-groups stated they had not considered, but acknowledged that it is important this information be brought into subsequent planning cycles, highlighting the need to record reflections in order to learn from past experiences.
Within these indicators there is not the opportunity to capture the institutional policies or programs being developed by stakeholders at other geographic or governance levels. These policies or programs can effect local community resilience across scales potentially impeding or strengthening scale-specific autonomy or adaptive capacity. Currently, each of the sub-groups identified that they were not informed of policies or programs developed for their community that could have a significant impact on their ability to enhance their resilience.
It also became apparent that there was a large number of informal arrangements operating within communities that support planning and preparedness activities. For example, in several of the sub-group communities it is the role of the school bus driver to monitor creek and river levels in order to determine when it is time to collect children from nearby schools. Similarly, the local store has a large role in preparedness and recovery operations by communicating updates on events and providing basic services and goods. Several communities have assisted the store owners to access generators during emergency events, recognising the importance of the communication hub, and access to key services provided by the store. These arrangements emphasise the importance of place-based strategies to prepare, respond and recover from extreme weather events.
Four out of the five communities gained a caution rating for this section of the Scorecard with one community scoring a `red-zone’ rating. This section required diverse knowledge of state government and service provider practices and policies. None of the participating sub-groups had considered, or were able to obtain, the relevant information required to support the application of the Scorecard. For example, all of the sub-groups considered the educational indicator to be important. However, in Queensland schools, the level of education about emergency preparedness is determined by each school independently (Queensland Education Department, 18 November 2013). None of the participants had been personally involved in these activities, or were aware of them. A similar discussion ensued about the medical services and hospital emergency planning indicator, as this would involve obtaining information from multiple organisations across the region. Although these were perceived as important indicators, accessing the appropriate data for these smaller communities was problematic. This highlights the absolute dependence of the small communities on adequate regional and state-level planning, in regard to hospitals and education.
Another finding that emerged from this section of the Scorecard relates to the level of household resilience evident in many of the smaller communities. Many of the participants were relatively independent in providing critical services for themselves (e.g. water tanks, food production, gas cooktops and generators). As all of the sub-groups were affected by flooding almost annually, the general sentiment was that people knew how to `do floods’ and that the concern was centred on the effect of other emergencies for new residents who did not have experience in dealing with these extreme weather events.
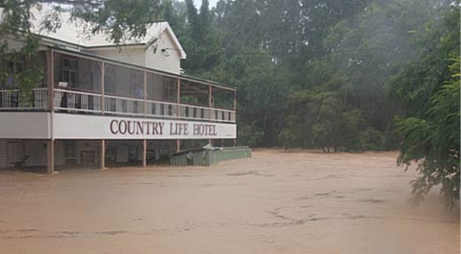
Image: Harden Up Qld, Kupa Ngaira
Floods engulf the Country Life Pub at Kin Kin in 2009.
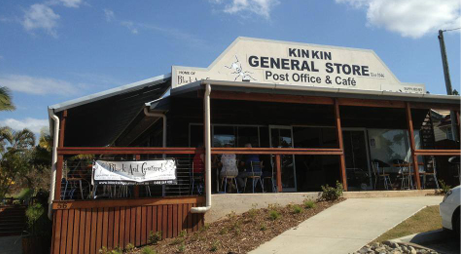
Image: Kin Kin General Store
The Kin Kin General Store is a communication hub for the community.
The objective of this study was to present an assessment of the level of resilience of high risk, small rural communities to emergencies and disasters, and to determine whether there is sufficient information in the public domain to apply the Scorecard appropriately. In regard to issues of concern, the analysis revealed weaknesses in each sub-group’s level of knowledge of procedures that support community disaster planning, response and recovery (Section 3), and their inability to acquire the required data to undertake the assessment. In particular, complementary policies and processes that occur at a state government level or by key service providers were unknown to the participating sub-group members. These discussions also revealed a rich network of informal, place-specific local responses to emergencies and disasters. In general, each community displayed a good level of knowledge in regard to their risk and vulnerabilities, which may be attributed to the membership of QFRS volunteers. Similarly, other strengths relate to the communities’ involvement and understanding of the emergency planning, response and recovery resources within their community.
In order for smaller communities to make use of and benefit from the Scorecard an extensive data compilation is required to be provided to the participating communities. As illustrated, it is unrealistic to expect communities to undertake their own extensive data gathering. It is apparent there are numerous sector-specific sub-plans and action plans developed by government, business and humanitarian community groups that consider elements of disaster resilience that impact on a community’s resilience. Providing communities with these key pieces of information, in addition to a localised household survey, would transition the results of the survey from a perception-based estimate of a few members of the community, to a more reliable assessment of resilience. Additionally, an efficient provisioning of information could support social learning within the community and re-align the community’s perception of what services and support they can realistically expect from emergency services providers during an emergency. Furthermore, a focus on communication and public education for new residents and concern over new development approvals were some of the key issues that all of the sub-groups discussed while undertaking the Scorecard assessment.
In conclusion, there is no doubt that the Scorecard represents a step forward in engaging communities to coalesce local knowledge and skills in preparing for emergencies and disasters at the scale in which responses are enacted. Further, this study demonstrates that the participating communities were supportive of the idea of assessing their resilience and the active involvement of government in directing and supporting communities to build their capacity. Despite this, the inescapable conclusion is that the Scorecard could not be applied in the manner in which it was originally designed, and that there are a number of indicators that are not suited to small rural communities. However, the Scorecard was successful in stimulating discussion and knowledge-sharing about topics relevant to the local disaster management sub-groups.
The authors would like to acknowledge the volunteer participation of each of the sub-group communities in undertaking this project. We also like to acknowledge the contribution to the paper by the two anonymous peer-reviewers that has resulted in an improved article. Finally, the authors would like to acknowledge the funding for the project, gratefully received from the University of the Sunshine Coast and the Sunshine Coast Regional Council’s Partnership Grant.
Arnstein SR 1969, A ladder of citizen participation. Journal of the American Institute of planners, 35.4 pp. 216–224.
Arbon P 2014, Developing a model and tool to measure community disaster resilience, Australian Journal of Emergency Management, vol. 29, no. 4, pp. 12–16.
Gebbie K, Cusack L, Perera S & Verdonk S 2012, Community Disaster Resilience Scorecard Toolkit, Torrens Resilience Institute.
Australian Bureau of Statistics 2011, Census of Population and Housing, Basic Community Profile. At: www.censusdata.abs.gov.au/census_services/getproduct/census/2011/communityprofile/0 [3 December 2013].
Australian Government 2011, National Strategy for Disaster Resilience, Attorney General’s Department, Barton ACT, Australia.
Australian Government 2014, National Strategy for Disaster Resilience Public Engagement Framework, Attorney General’s Department, Barton ACT, Australia. At: www.em.gov.au/Publications/Australianemergencymanualseries/Pages/National
StrategyforDisasterResilienceCommunityEngagement
Framework.aspx [26 June 2014].
Chandler D 2012, Resilience and human security: the post-interventionist paradigm Security Dialogue 43, pp. 213–29.
Cohen O, Leykin D, Lahad M, Goldberg A & Aharonson-Daniel L 2013, The conjoint community resiliency assessment measure as a baseline for profiling and predicting community resilience for emergencies. Technological Forecasting and Social Change.
Cutter SL, Barnes L, Berry M, Burton C, Evans E, Tate E & Webb J 2008, A place-based model for understanding community resilience to natural disasters. Global Environmental Change, 18 (4), pp. 598–606.
Cutter S, Burton C & Emrich C 2010, Disaster Resilience Indicators for Benchmarking Baseline Conditions Journal of Homeland Security and Emergency Management, 7, p. 1.
Eriksen S & Brown K 2011, Sustainable adaptation to climate change, Journal of Climate and Development, vol. 3, issue 1, pp. 3–6.
Frazier T, Thompson CM, Dezzani RJ & Butsick D 2013, Spatial and temporal quantification of resilience at the community scale, Applied Geography, 424, pp. 95–107.
O’Jenkins W 2011, Measuring Disaster Preparedness: FEMA Has Made Limited Progress in Assessing National Capabilities Testimony Before the Committee on Homeland Security and Governmental Affairs, U.S. Senate. Released 17 March 2011.
Paton D 2006, Disaster resilience: integrating individual, community, institutional and environmental perspectives. Disaster resilience: An integrated approach pp. 305–316.
Rodima-Taylor D, Olwig M & Chhetri N 2012, Adaptation as innovation, innovation as adaptation. An institutional approach to Climate Change. Applied Geography, 33, pp. 107–111.
Romero Lankao P 2007, How do local governments in Mexico City manage global warming? Local Environment: The International Journal of Justice and Sustainability 12, 5, pp. 519–535.
Shaw R, Takeuchi Y & Jonas J 2010, India City Profile: Climate and Disaster Resilience Consultation Report At: www.preventionweb.net/english/professional/publications/v.php?id=15263 [2 July 2013].
Torrens Research Institute 2012, Developing a model and tool to measure community disaster resilience. Community Disaster Resilience Scorecard Toolkit. At: www.torrensresilience.org #sthash.Qd8Ui3fV.dpuf [29 January 2014].
Vugteveen P, Lenders HR, Devilee JL, Leuven RS, van der Veeren RJ, Wiering MA & Hendriks AJ 2010, Stakeholder value orientations in water management. Society and Natural Resources, 23, 9, pp. 805–821.
Walker B & Salt D 2006, Resilience thinking. Sustaining ecosystems and people in a changing world Island Press, Washington DC.
Dr Lila Singh-Peterson, Prof Paul Salmon and Dr Natassia Goode are researchers located at the University of the Sunshine Coast within the Sustainability Research Centre and the University of the Sunshine Coast Accident Research Centre. Mr John Gallina is the Disaster Management Team Leader at the Sunshine Coast Council.