Providing for vulnerable people in communities during a disaster is a concern for New Zealand Civil Defence Emergency Management (CDEM) as these groups are both harder to reach with preparedness messages and are likely to need additional assistance in a disaster. Recent disaster events have shown there is a greater risk of death and injury for these groups. For example, in New Orleans during Hurricane Katrina, over three quarters of those killed were aged over 60, despite this group making up only 15 per cent of the population (AARP 2006). As vulnerable community members can be difficult for CDEM to identify, this study aimed to examine the ways community-based organisations could work with CDEM to provide special needs groups with the support they need, and increase emergency preparedness.
Previous attempts to identify vulnerable community members have focussed on geographical mapping of vulnerability (e.g. Morrow 1999), however this study focuses on using social networks already present in the community through community support workers. The rationale for using these existing social networks is that support workers have strong connections to their clients and understand their needs. Social support for vulnerable communities has proven benefits for resilience both in an emergency and prior to an emergency occurring. Staley, Alemagno & Shaffer-King (2011) found a relationship between reduced social isolation and emergency preparedness. Norris & Kaniasty (1996) previously reported that both perceived and received social support are important to resilience in disasters; the amount of support older people believe they will receive in a disaster may be more important to their resilience than how much support they actually receive. Like most organisations, community-based organisations will take time to restart after an emergency, but they can work with clients to improve preparedness and reduce the impact of their absence immediately after an event. In addition to formal support through community-based organisations, the majority of people have other social networks they can draw on for support including family, friends, neighbours and social groups such as churches, sport and hobby groups. The Statistics New Zealand Quality of Life Survey (2008) indicates that 97 per cent of New Zealanders belong to some form of social network. Community-based organisation staff can therefore work with clients to use these social networks as ’back-ups‘ in the case of emergency.
Experience from the Canterbury earthquakes in 2010 and 2011 emphasised the benefits of using these networks. For example, when vulnerable community members were identified as needing extra support in the Waimakariri district, social service groups in the area formed an interagency network to provide for their clients (S. James, personal communication, April 20 2012). Therefore there is evidence to suggest that community groups and agencies are a good way to contact and engage with vulnerable members of the community, such as the elderly, people with physical or mental disability, refugees and migrants. In a previous review of preparedness research, Finnis (2004) suggests developing relationships with such groups is an important step in developing mitigation measures. Following the Loma Prieta earthquake in California in 1989, community-based organisations developed a formal collaborative framework, known as CARD (Collaborating Agencies Responding to Disasters,
www.cardcanhelp.org 2012). CARD works as a link agency between community-based groups and emergency management and ensures community agencies can support their functioning after an event. It has proven to be a successful model for improving community-based organisation preparedness by providing resources and training to those working with vulnerable groups. This paper includes the results of a project conducted with community-based organisations in the greater Wellington region that aimed to establish a model for engagement with vulnerable community members.
For the purposes of the study, the term ‘community-based organisation’ (referred to as CBO) refers to agencies that provide support to clients in their everyday life, in most cases in the client’s home. These groups include (but are not limited to) groups that work with the elderly, those with physical disabilities, and those with mental health conditions. It is difficult to define what constitutes a vulnerable person or community. Definitions may be wide as all people are vulnerable in different situations or at different times in their lives (Handmer 2003, Norris et al. 2008, Bird et al. 2012). For this research vulnerable is defined as ‘Any person whose daily living is supported in some way by a CBO’. This research focusses primarily on communities identified as having daily support needs, rather than all those vulnerable. Therefore, the population studied may not necessarily all be vulnerable in a disaster, and likewise will not represent all those who will be vulnerable.
The research examines the connections between CBOs and their clients, and how these connections can be used to increase emergency preparedness in vulnerable populations. As a result, a guide for Emergency Management Advisors working with CBOs was developed to implement a programme for improving their clients’ emergency preparedness. The results of a survey of clients, staff and management of a number of CBOs are presented examining the needs of each group, the expectations they have of others and their understanding of processes in place for an emergency event. The implications of these results to inform practical solutions are discussed.
Three surveys were created for each of the key groups being clients, support workers, and management of CBOs. The main focus of the surveys was to identify gaps in expectations between the different groups. The main topics included:
An invitation to participate in the survey was distributed to the management of a number of CBOs. A snowballing technique was used to recruit further CBOs to take part in the project. The survey was completed in either a web-based or paper-based version (both using Survey Crafter Professional 4.0). The method of distribution to staff was up to the individual organisation and staff were asked to distribute the survey to a selection of their own clients. The number of each survey type completed is included in Table 1.
Table 1. Number of survey participants for each survey type.
|
Survey type |
Frequency |
Percentage of sample |
|
Client |
70 |
50.7% |
|
Support worker |
53 |
38.4% |
|
Management |
15 |
10.9% |
|
Total |
138 |
A sample of participating organisations was also invited to a workshop to discuss the results and develop solutions for the issues raised.
On average, clients identified 2.19 agencies that they received regular support from. Table 2 shows the frequency of client visits based on client and support worker reports. Overall, most receive visits from CBOs once a week.
Table 2. Frequency of client visits.
|
How often would you have a visit from someone from any community-based organisation? |
What is the most often you would visit any of your clients? |
What is the least often you would visit any of your clients? |
|
|
Every day |
17.0% |
11.4% |
2.8% |
|
4-6 times a week |
24.5% |
12.9% |
5.8% |
|
2-3 times a week |
22.6% |
25.7% |
15.4% |
|
Once a week |
18.9% |
27.1% |
30.8% |
|
Once a fortnight |
1.9% |
4.3% |
9.6% |
|
Once a month |
0% |
8.6% |
11.5% |
|
Other |
15.1% |
10.0% |
21.2% |
Clients were also asked if they had ever missed an appointment with a CBO and the impact that would have on their daily living. Fourteen per cent had missed an appointment in the past, and over half of respondents indicated that missing an appointment would have some or a large impact on their daily living.
Support workers were also asked how many clients they personally support. On average, support workers were supporting 14 clients. This result suggests that support workers are probably unable to provide support to all their clients in an emergency situation as this is a high workload, particularly as there could be constraints to their ability to travel easily.
For an understanding of the level of social connectedness of the clients (and therefore the potential for support networks outside the CBOs), participants were asked the questions presented in Figure 1. As can be seen in the figure, only a small number of participants talk to their neighbours on a regular basis, but most have contact with friends or family outside the home regularly. Around half also participated in activities in their community. These results suggest there are wider social networks available to most clients, but there could be improvement to relationships with neighbours, particularly due to their close proximity in a disaster.
Figure 1: Social connectedness of clients outside community-based organisations.
-01-01.png)
Clients were asked what preparedness measures they currently had in place (see Figure 2). Overall, clients were reasonably well prepared. However given the likelihood of needing assistance from others, the main concern is that only 35 per cent have an emergency plan which includes the contact details of support network members.
Figure 2: Preparedness measures clients had in place.
-01.png)
The majority of participants also indicated that their medications would last for a week or more, suggesting they had planned for their medication needs. However, almost 40 per cent of participants also suggested they could not stay in their own home for the recommended three days without assistance.
Participants in the client sample were asked for some information about the needs they would have in an emergency situation and the support they would have available. The majority of clients surveyed lived alone (57 per cent), 7 per cent with family, 7 per cent with friends, 13 per cent with flatmates and 15.7per cent in another living situation (including residential care facilities). The majority believed that those with whom they lived could provide most of the support they would need in an emergency (53 per cent), however 18.6 per cent believed they would get none of the support they would need from those they lived with.
Table 3 presents client expectations of whom they believed would help them in a disaster if they needed to evacuate. Of those who indicated they would need help, 37 per cent indicated emergency services or CDEM would help them, and 23 per cent identified a CBO.
Table 3. Sources of help for vulnerable clients if assistance was needed to evacuate.
|
Source of assistance |
Percentage of sample1 |
|
I wouldn’t need help, I could evacuate myself |
41.4% |
|
People living in my home with me |
28.6% |
|
My neighbours |
17.1% |
|
Family or friends |
28.6% |
|
Emergency services/civil defence |
37.1% |
|
This or another CBO |
22.9% |
|
I don’t know who would help me |
7.1% |
Participants were asked how easily they would survive without CBO contact in an emergency, as presented in Figure 3. The majority of respondents believed (e.g. agreed or strongly agreed) they could cook their own meals (55.7 per cent), but a large number (42.8 per cent) were concerned that missing an appointment would have a large impact on their daily living. Most (56.5 per cent) thought a family member or friend would check on them in an emergency, but fewer believed this about their neighbours (40.6 per cent).
Figure 3: Client attitudes to emergency needs in absence of community-based organisation support.
-01.png)
Clients were asked how likely they thought it would be to receive a phone call or a home visit from a support worker after a disaster. These responses were compared with support worker expectations. Figure 4 presents the mean rating of the participants in each group, with scores closer to 5 indicating a high likelihood. Support workers indicated they would be significantly more likely to attempt to call their clients than the clients expected, t(114) = -2.18, p<.05. There was no significant difference in the rating of likelihood of a visit.
Figure 4: Client and support worker expectations of contact after a disaster.
-01.png)
Support workers were asked about their own preparedness for a disaster; 73.1 per cent rated their preparedness as ‘good’ or ‘very good’, with another 23.1 per cent rating it as ‘average‘. Over 60 per cent indicated that it would be ‘easy’ or ‘very easy’ for them to incorporate emergency preparedness messages into the work they already do with their clients if they were provided with the right resources; outlined in Figure 5. The most popular suggestions were printed materials and training.
Figure 5: Identified resource needs for support workers to deliver preparedness messages.
-01.png)
Both support workers and CBO management were asked about the post-disaster plans and processes in place in their organisation to identify any gaps or miscommunications between these groups. The majority (64.2 per cent) of support workers were aware of some policy within the organisation for restarting operations after a disaster, and the majority believed there were systems in place within their organisation for prioritising clients (56.9 per cent). Even in the absence of any formal organisation systems, 62.3 per cent suggested they would have their own prioritisation system.
However, despite the majority of support workers being aware of the existence of policies for business continuity, there was room for improvement shown in the communication of what these plans meant to staff in a practical sense. For example, Figure 6 shows that 26.7 per cent of managers anticipate staff would not wait to be contacted before they returned to work, however only 17.3 per cent of staff anticipated this would be the case. Overall the vast majority of both staff and management expected that managers would contact staff. Therefore a process needs to be established within CBOs to ensure this will occur.
Figure 6: Support worker and management expectations around returning to work after a disaster.
-01.png)
A large number of CBO clients deal with multiple agencies. Figure 7 and Figure 8 outline the expectations of support workers and management around the care of shared clients with other agencies. Overall, staff generally believed there were more arrangements in place than there actually were (based on management responses) in both non-emergency and emergency periods.
Figure 7: Support worker and management expectations of arrangements with other agencies in peacetime.
-01.png)
Figure 8: Support worker and management expectations of arrangements with other agencies in emergency.
-01.png)
Finally, both support workers and their managers were asked about their attitudes to providing support to their clients in an emergency. For the questions shown in Figure 9, support workers were asked how much they agreed with each of the statements for themselves. Those responding from management were asked how much they agreed these statements would be true for their support workers.
Figure 9: Support worker and management attitudes to providing care after a disaster
-01.png)
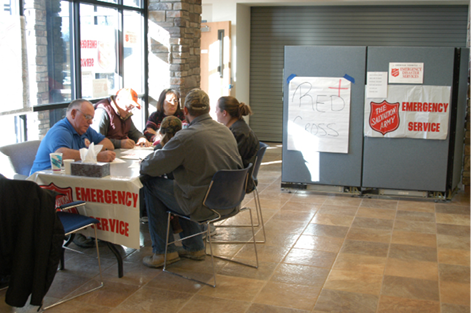
Image: George Armstrong, FEMA
Many volunteer agencies bring disaster aid to victims.
Lessons from the Canterbury earthquakes indicate that support workers are well-placed to engage with vulnerable communities because of their existing, trusted relationships with their clients (S. James, personal communication, April 20 2012). Support workers are unlikely to provide direct support to all their clients in an emergency due to the high number of clients on average per worker (M = 14.09), in addition to having their own personal priorities to deal with. This finding emphasises the need for CBOs to engage with their clients to improve personal support networks and other emergency preparedness activities. The key preparedness concern for vulnerable groups is improving planning for support during an emergency. Their reported levels of physical resource preparedness is similar, or better than, the general population, but the amount of planning for support networks is poor.
While not formalised through planning for an emergency situation, the perceived support of family, friend and CBO networks was high for those surveyed. This indicates that vulnerable community members will have the positive effects on their resilience indicated by previous research (e.g. Norris & Kaniasty 1996). One area that could be improved is their connections to neighbours as very few participants indicated a close relationship. This contact should be encouraged as those in closest proximity in a disaster will have better immediate capacity to assist.
In addition to personal support back-ups, CBOs need good business continuity planning to provide support as soon as possible after a disaster. One way this planning could be improved that was identified through this research is through improved communication of existing plans to staff. It was found that staff are aware of the planning being in place, but are unaware of how the plans affect them directly, particularly around their return to work.
The research also established a willingness of organisations to work together, as well as confirming there is a strong overlap between the organisations and the clients they care for. Therefore there may be scope in New Zealand in the future to establish formal relationships between agencies providing support to vulnerable community members, such as is undertaken by the CARD project in the United States. However such an arrangement will first require a number of barriers to be overcome. The key issues identified within the workshop process were related to client privacy and identifying and resourcing an agency to manage the co-ordination of information. Some information sharing does occur reactively in an emergency event, but there is still a need for proactive, pre-event co-ordination.
A guide for Emergency Management Advisors was developed based on this research to engage with CBOs to help improve the emergency preparedness of their vulnerable clients (Wellington Region Emergency Management Office 2013). The findings presented form an evidence base for a programme of training and resources for support workers in the community. One such resource was an emergency checklist for ensuring planning is done with vulnerable community members and communicated to all members of their support network. It allows a clear method of communication between support workers as many vulnerable clients will be supported by multiple agencies. This removes the concern that preparedness messages are repeated unnecessarily and possibly upsetting clients.
This research shows that CBOs and their staff are willing and able to assist emergency management organisations in engaging with vulnerable community members who may not be reached by standard preparedness messages and campaigns, despite their increased need for that support. However this assistance needs to be given in context of their everyday work with clients on often limited timetables and budgets, so efficient training and resources are required. The Emergency Management Advisor’s guide provides the resources based on this research in a way that works within the current support worker’s role.
This research was funded by the Ministry of Civil Defence and Emergency Management CDEM Resilience Fund. The authors would also like to acknowledge Wellington Region Emergency Management Office and Wellington City Council for their involvement, as well as all the community-based organisations and stakeholders that took part in the survey and workshop.
AARP 2006, We can do better: Lessons learned for protecting older persons in disasters. Washington, D.C. AARP.
Bird, D, King, D, Haynes, K, Box, P, Okada, T & Nairn, K 2013, Impact of the 2010–11 floods and the factors that inhibit and enable household adaptation strategies, National Climate Change Adaptation Research Facility, Gold Coast.
Collaborating Agencies Responding to Disasters 2012, At: www.cardcanhelp.org [16 January 2012].
Finnis, K 2004, Creating a resilient New Zealand: Can public education and community development campaigns create prepared communities? An examination of preparedness motivation strategies. Report for the Ministry of Civil Defence and Emergency Management. MCDEM: Wellington.
Handmer, J 2003, We are all vulnerable. Australian Journal of Emergency Management, 18(3), pp. 55-60.
Morrow, BH 1999, Identifying and mapping community vulnerability. Disasters, 23(1), pp. 1-18.
Norris, FH & Kaniasty, K 1996, Received and perceived social support in times of stress: A test of the social support deterioration deterrence model. Journal of Personality and Social Psychology, 71(3), pp. 498-511.
Staley, JA, Alemagno, S & Shaffer-King, P 2011, Senior adult emergency preparedness: What does it really mean? Journal of Emergency Management, 9(6), pp. 47-55.
Statistics New Zealand 2008, Quality of Life Survey. Wellington: Statistics New Zealand.
Wellington Region Emergency Management Office 2013, Working with social agencies to support vulnerable communities. Wellington Region CDEM Group: Wellington. At: www.getprepared.org.nz/publications.
Kate Mora is a Senior Researcher in the Behavioural Sciences team at Opus Research, a unit of Opus International Consultants. She has particular interest in using an applied psychological approach to studying behavioural responses following natural hazard events, and developing methods to predict future behaviour.
Dr Jared Thomas is Research Manager of the Behavioural Sciences team at Opus Research. He has over a decade of experience in applied psychology, in particular research methods, scale development and attitude shift, including responses to natural hazard events.
Kathryn Nankivell was formerly an Emergency Management Advisor at the Wellington Region Emergency Management Office. She has a particular interest in working with vulnerable community members and engagement with community-based organisations.
Stephen Flude was formerly the Community Resilience Adviser at Wellington City Council. In this role, he worked closely with a range of community-based organisations on improving resilience in the community.