Natural disasters have increased in severity and frequency in recent years. In 2010, for example, 385 natural disasters killed over 297 thousand people worldwide, impacted 217 million human lives and cost the global economy an estimated US$123.9 billion (Guha-Sapir et al. 2011). The World Disasters Report (IFRC 2012) notes that in 2011, 15 million people were forced to move worldwide due to hazards and disasters. Recent Australian examples of natural disasters include the decade-long drought (2003–2012), the 2010–2011 floods in Queensland which affected 70 towns, including Brisbane, with an estimated $8 billion in net additional spending for rebuilding (RBA 2011), Cyclone Yasi was originally estimated to cost $800 million for the cost of rebuilding public assets and providing support to the community (Queensland Government 2011, p.66), and Victoria's 2009 Black Saturday bushfires, killing 173 people, impacting 78 towns and having an estimated $2.9 billion in total losses (Stephenson, Handmer & Harwood 2012). This article is an abridged version of a comprehensive report, The Pilot Impacts Portal: Towards an Emergency Response Planning Tool, which describes the portal and project in more detail (Power et al. 2012).
The Pilot Impacts Portal is a web accessible user interface to a collection of data items relating to the Impacts Framework (Stephenson 2010). This framework, developed by RMIT University and the Bushfire CRC, is based on economic principles and defines the process used to determine the economic, social and environmental impacts, losses and benefits resulting from a natural disaster.
The framework is used as a guide to determine and measure the impacts resulting from an event. It achieves this by identifying the elements contributing to the consequences of an event, defining the relationships between them and by informing the collection of information on a wide range of natural disasters. It can be used across any temporal or geographic scale, limited or broad. The framework provides an extensive list of possible impacts that the user can select depending on their area of interest and requirements. The framework is not limited to any one phase of the PPRR spectrum and can be used for emergency management, policy-making or other purposes.
Figure 1: The Impacts Framework (Stephenson 2010)
-01_fmt.png)
An overview of the Impacts Frameworks is depicted in Figure 1 (see Stephenson 2010). This figure is interpreted from top to bottom using the text below each box to explain the process of identifying an impact. Doing so reveals an event comprises a number of event characteristics which can have an effect on an object possibly causing harm which can lead to a range of observed and (in many cases) measurable impacts, which can be categorised under economic, social or environmental. Note that both space and time increase as these steps progress. Also, the prevention and preparedness aspects of emergency management practices are shown on the left while the role of response and recovery are on the right.
Figure 1 defines a ‘top-down’ approach for describing how to arrive at an impact by refining the disaster event into its constituent characteristics and considering the effects these have on real world objects in turn. This ‘top-down’ approach, common in management and organisations (for example a ‘work breakdown structure’), partitions the problem into smaller sub-problems. In summary, starting from a specific event, the framework notes the possible event characteristics, how they interact with an object in the real world, and the harm that may be caused which results in a specific impact.
The Australian Natural Disasters Impacts Framework Project (Impacts Project 2012), is managed by Fire & Rescue New South Wales (FRNSW). The motivation for the project can be summarised by the following question:
Do we know where to best allocate investment across the PPRR spectrum to increase community safety and reduce the costs and social effects of emergencies and disasters?
Various Council of Australian Governments (COAG) reviews have highlighted the need for more comprehensive data on the full costs of natural disasters and emergency risk management services. This will enable governments and communities to undertake cost benefit assessments and identify the most cost effective mix of risk-based emergency management investment in PPRR interventions across all hazards.
At present, collating all the available data necessary to identify the total costs of emergency risk management within a community is extremely difficult and beyond the capacity of most stakeholders. Some of the key data required is currently not collected or is inaccessible. Case studies tend to focus on one disaster or type of emergency and hence do not provide an ‘all hazards’ view of the costs and benefits of emergency risk management investment.
The COAG Report Natural Disasters in Australia (Australian Government 2002, p. 14) lists 12 recommendations for all levels of government to reform Australia’s natural disaster management. The first two are:
The second recommendation was the original motivation for the Impacts Project. This is the overriding requirement to be fulfilled.
There have also been other significant reports and findings recommending a unified and comprehensive approach to emergency management and reducing risks. A summary follows:
There are also state and territory initiatives tackling similar issues. These groups and their reports all advocate, among other findings, the need for improved access to relevant information for the purposes of emergency planning and response.
In effect, it’s important to deliver the right information to the right people in the right format in the right place at the right time.
The portal is a platform to show the benefits of having a single point of access to a wide collection of data items that can be used for evidence-based decision making. The aim is to foster an emergency management user community focused on a national resource (the portal).
An example of the information available is shown in Figure 2 where various historical natural disaster events are displayed with icons and overlays showing the events matching the chosen options.
Figure 2: Displaying events with impacts
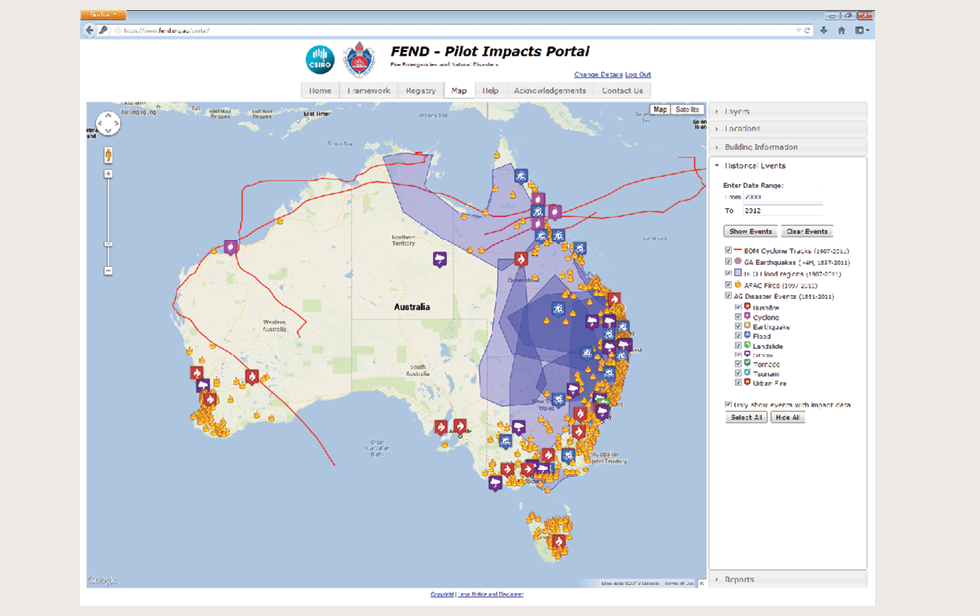
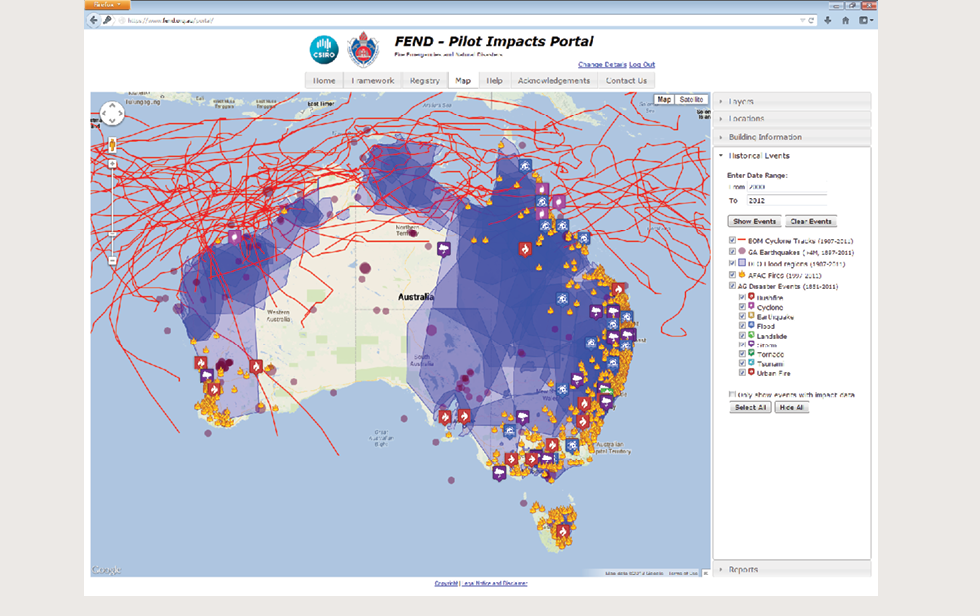
Figure 2 shows all the events that occurred from 2000–2012 which include impact information. The key to the icons and overlays can be seen next to its data source. For example cyclone tracks are shown as a red line, floods as a blue region and so on. There are more event details available in the portal when the restriction to only display those with associated impact information is relaxed. This can be seen in Figure 3 where the same screen shot is shown, except the check box ‘Only show events with impact data’ has been un-checked.
Figure 3: Displaying all events
The portal collates data from various sources to report against the Impacts Framework. The data is categorised as described in Table 1.
Table 1: Data item categories
|
Category |
Description |
|
Framework |
The Impacts Framework |
|
Baseline |
Context in which an event occurs |
|
Historical Events |
Information about specific events |
|
Historical Impacts |
Measured impacts caused by an event |
|
Mitigation & Recovery |
History of funds spent and actions performed in a region for PPRR |
The portal does not provide the facility to conduct modelling or forecasting. It was not designed to analyse the total impacts of natural disasters on a community; nor was it designed to be used for monitoring the current situation during a disaster event. All data available in the portal is managed locally. For example, there are no live data feeds or data obtained from web services. Consequently, data management, adding new items and updating existing ones, is the responsibility of the portal administrator.
The portal user represents a large collection of possible users ranging from emergency management personnel (people associated with firefighters, ambulance officers, police, rescue personnel, SES, and so on), government (federal, state and local agencies), and community groups. These users will each have a particular objective when using the portal broadly defined as supporting evidence-based decision making on where best to allocate investment across the PPRR spectrum to increase community safety and reduce the costs and social effects of disasters.
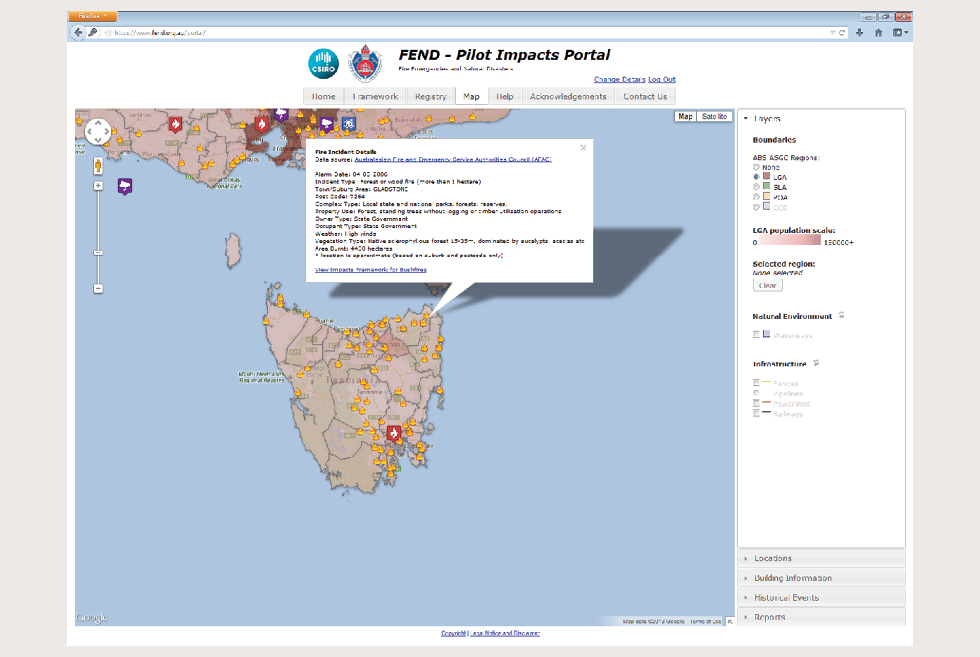
The Pilot Impacts Portal integrates data managed by various government agencies using a Google Map interface that allows users to access disaster event information by geographic region. The Google Map provides street map, terrain and satellite imagery backdrops for Australia and the map is overlaid with further geographic data. The example in Figure 4 shows historical fires in Tasmania with the local government areas layer displayed and the details of a specific fire incident shown in a popup window, activated by clicking the fire icon.
Figure 4: The map view showing Tasmanian fires, local government areas and details of a selected event
The user interface provides various access paths to this information allowing the portal user to:
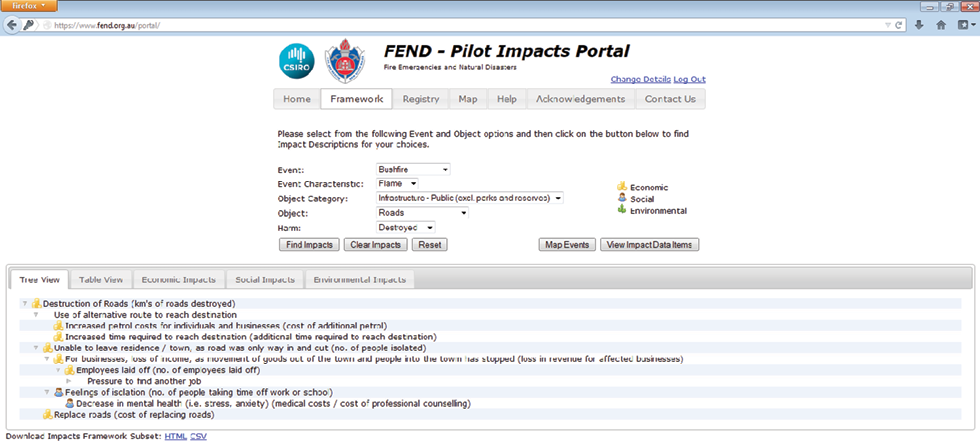
The content of the Impacts Framework can be explored as shown in Figure 5. In this example, the user has navigated to that part of the Impacts Framework associated with the destruction of roads, as a category of public infrastructure, caused by the flames of a bushfire. The result is the direct impact ‘Destruction of Roads’ which has been expanded to show the consequential impacts that can also result. These are termed indirect impacts. Note that an indirect impact may cause another subsequent indirect impact up to a ‘depth’ of five.
Figure 5: The Impacts Framework Internet Explorer user interface
The reporting features are demonstrated in Figures 6 and 7.
Figure 6: Newcastle earthquake (1989)
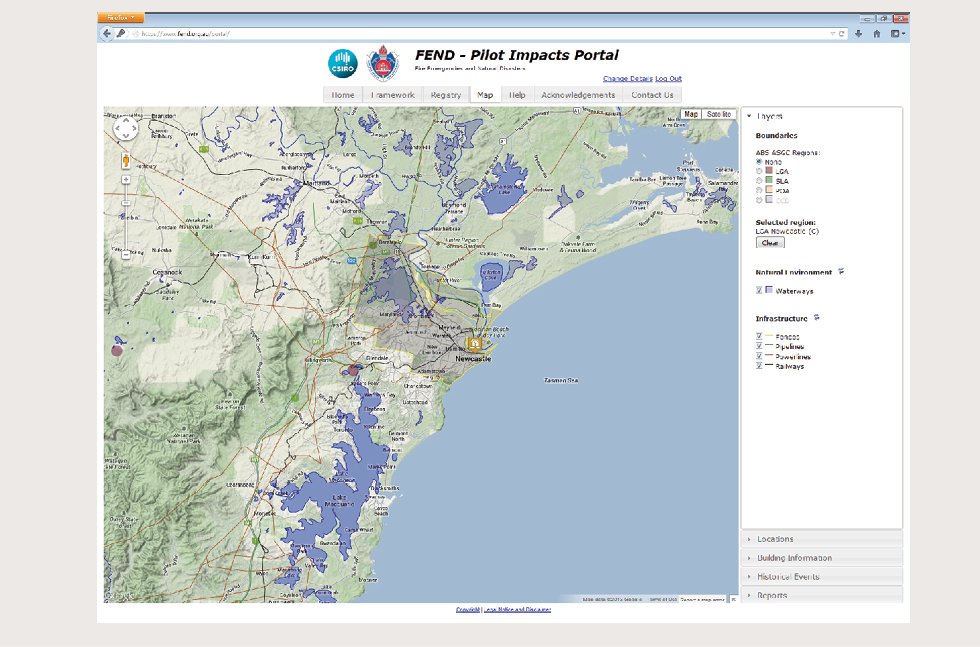
Figure 6 shows the map zoomed to the Newcastle, NSW region, with the terrain relief enabled and further infrastructure and natural environment data included. Note there are three earthquake icons displayed—two from the Geoscience Australia Earthquakes database (the circles) and one from the Attorney-General’s Department (AGD) Disasters Database (the icon). These datasets have different spatial resolution for the events they describe (explained further on).
Figure 7: Generated report (subset) for the Newcastle local government area
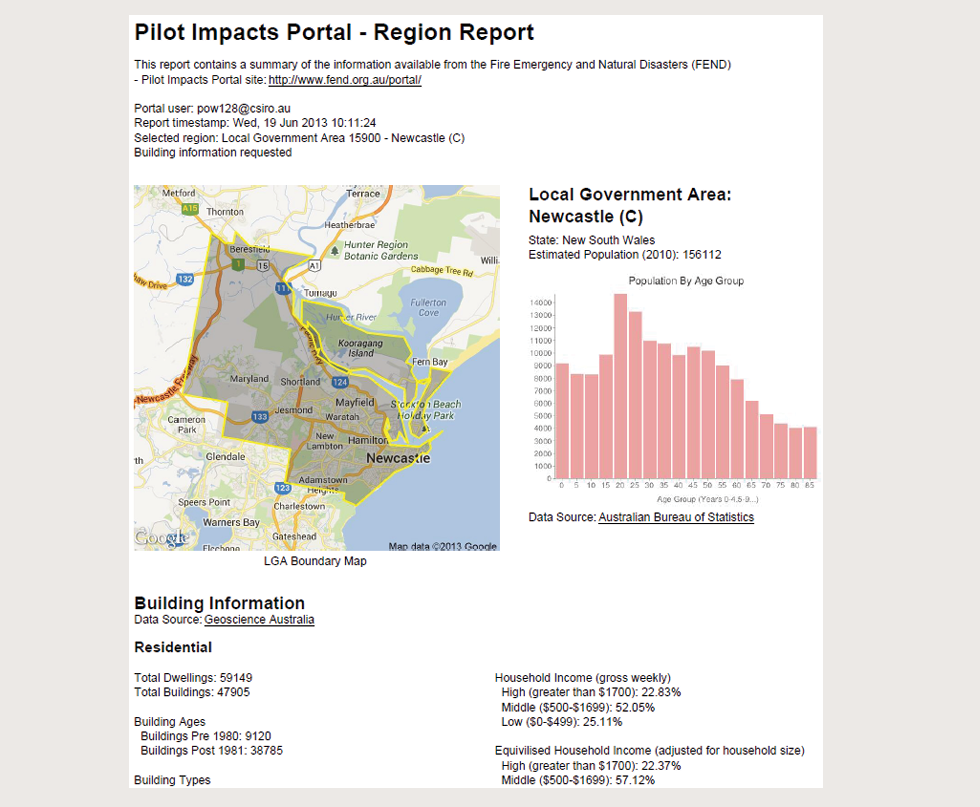
Figure 7 shows a subset of an example report generated summarising the information of Figure 6. This information is expected to provide evidence for the user to support their investigation and is a PDF document which includes:
Another output available for a user is a data extract. This is a comma-separated values (CSV) file containing a subset of the data items available in the portal for a selected region. This feature allows a user to explore relevant data items using tools available to them.
Further examples of how the portal may be used include:
The portal has been developed with these goals in mind and it is up to the user community to provide feedback on how successful this has been.
A summary of the data items available in the portal is shown in Table 2. The data item ‘custodian’ is noted along with its category as defined in Table 1. Note that a mix (by years) of ABS Australian Standard Geographical Classification (ASGC) boundaries were used due to the availability of associated population demographics for these regions at the time of development.
Table 2: Summary of portal data items
|
Data Item |
Custodian |
Categories |
|
Impacts Framework |
FRNSW |
Framework |
|
ASGC CD 2006 |
ABS |
Baseline |
|
ASGC LGA 2010 |
ABS |
Baseline |
|
ASGC POA 2010 |
ABS |
Baseline |
|
ASGC SLA 2010 |
ABS |
Baseline |
|
BCP 2006 |
ABS |
Baseline |
|
Populations 2010 |
ABS |
Baseline |
|
National AIRS DB |
AFAC |
Event/Impacts |
|
Disasters Database |
AGD |
Event/Impacts |
|
AHGF |
BOM |
Baseline |
|
Tropical Cyclones |
BOM |
Event |
|
DFO |
Colorado Uni |
Event/Impacts |
|
Earthquakes DB |
GA |
Event |
|
GEODATA Topo 250K |
GA |
Baseline |
|
NEXIS |
GA |
Baseline |
There have been a number of issues and obstacles encountered which include:
The data describing historical disaster events has varying levels of accuracy. Some data items include specific geographic coordinates, such as earthquakes and cyclone tracks, whereas others are described with a general location. For example, the AGD Disasters Database sometimes includes only a very rough idea of where the event was geographically located. Each event is assigned to one or more of the 143 map regions defining a grid for Australia. These regions are used to place icons on the portal’s Map View corresponding to the events occurring in these regions.
Locating events in this way is only approximate and has the added problem that multiple events in the same region are given the same location resulting in icons being stacked on top of each other. This was resolved by including a small random offset in these cases to disperse the icons so they can be distinguished. This process is known as ‘cartographic generalization’ and is a standard practice when rendering information on a map. This example highlights a difficultly when repurposing data. This is not an issue when presenting data in tabular form, but it is when displaying on a map.
A similar issue was that some locations are defined using place names. The Yahoo GeoPlanet web service1 was used to find a suitable place match. Note that the task of locating an event is performed during data loading to assign permanent geographic coordinates. The results were reviewed by a person and are subsequently used when displaying the events in the portal.
There were data quality issues with some of the data items obtained which were manually fixed. The Dartmouth Flood Observatory (Brakenridge 2011) is a global archive of large flood events available as a Shapefile (a popular vector data format for geographic information) with further data available as a CSV file. When displaying the flood extents as polygons, some did not correspond to their descriptive text. For example, there were flood events in Western Australia described as occurring in New South Wales and there were floods in South East Asia that were noted as occurring in Australia. The problem seemed to be a ‘shift’ of one row for the data in the Shapefile and corresponding CSV. This problem was manually fixed and the data custodian notified.
Also, the content of the AGD Disasters Database was revised during the course of the Impacts Project.2 The publicly available database was downloaded on four occasions and each time the amount of information available decreased as noted in Table 3. However, the quality of the information made available increased with each release.
Table 3: AGD Disasters Database summary
|
Date Obtained |
# Events |
# Impacts |
|
26 October 2011 |
790 |
232 |
|
1 February 2012 |
517 |
180 |
|
7 May 2012 |
244 |
102 |
|
22 June 2012 |
240 |
86 |
Improving the data is commendable, however an alternative would be to provide quality indicators at the record level. This would allow access to information that is otherwise not available, and places the responsibility on the user to interpret the data correctly.
Some data custodians have data, but it is not readily available for use in the portal due to cost, licensing constraints, availability, or sensitivity of the data. For example, the Public Sector Mapping Agency data costs approximately $50 000 per year to licence and data from Risk Frontiers could not be made publicly available.
There are data items relating to the Impacts Framework which exists as collections of reports describing, for example, specific natural disaster events, post-event surveys and risk studies. Some of these reports have been collected when they are available from web sites for use in the portal. However in many cases these reports exist, but are not available for the following reasons:
Comparing the list of data items currently available in the portal (see Table 2) against the content of the Impacts Framework identifies various gaps in the data obtained. Most notably, there has been no mitigation and recovery data items identified for use in the portal. While such data does exist the availability of this data has been an issue. Although agencies have data, it is not readily accessible since it only exists in individual reports distributed throughout organisations. Accessing these reports is problematic for the same reasons outlined above.
The portal went ‘live’ on 15 June 2012 and completed a 12-month trial at the end of June 2013. Members of the Australian emergency services community were notified of the release and in the first two weeks over 30 users registered. At publication there are over 100 registered users from over 40 agencies. Feedback from users about the usefulness of the portal is welcome especially related to ways it can be improved. FRNSW is planning the future deployment arrangements and in the meantime CSIRO will continue to host the portal.
The original aims of the Impacts Project were to provide emergency services organisations with better information about natural disaster events so they can improve their decision-making around PPRR investments in terms of community safety and reducing the impacts of future events. The Pilot Impacts Portal supports these aims. It is a tool to improve access to information about relevant historical events, allowing users to review the frequency and intensity of previous events for specific geographic regions and includes information on the built environment (via NEXIS) and demographic details (ABS data).
Effective emergency management requires finding the right balance between preventing and preparing for disasters and responding to and recovering from them afterwards. The Impacts Framework, upon which the portal is based, provides a systematic process for understanding the economic, social and environmental impacts associated with natural disaster events. This allows detailed planning options for managing emergencies to be explored in terms of a cost-benefit analysis.
There are a number of areas for future work:
The Impacts of Natural Disasters and Fire Emergencies is a national project managed by Fire & Rescue NSW. This project is part of the Natural Disaster Mitigation Program and is jointly funded by the Commonwealth and NSW Governments with 50 per cent contribution from the Commonwealth of Australia and 50 per cent from the NSW Government.
The authors wish to thank the anonymous reviewers for their helpful comments to the paper.
Australian Government 2002, Natural Disasters in Australia: reforming mitigation, relief and recovery arrangements. At: www.em.gov.au/Documents/Natural%20Disasters%20in%20Australia%20-%20Review.pdf.
Australian Government 2003, A Nation Charred: Report on the inquiry into bushfires. At: www.royalcommission.vic.gov.au/getdoc/977714b4-4610-4705-b0fd-d14859c23642/EXH.160.0001.pdf.
Australian Government 2004, Connecting Government: Whole of government responses to Australia’s challenges. At: www.apsc.gov.au/publications-and-media/archive/publications-archive/connecting-government.
Australian Government 2005, Review of Australia’s Ability to Respond to and Recover From Catastrophic Disasters. At: www.ag.gov.au/RightsAndProtections/FOI/Documents/Review%20of%20Australias%20Ability%20to%20Respond%20to%20and%20Recover%20from%20Catastrophic%20Disasters%20-%20Report%20October%202005.pdf.
Brakenridge, G R 2011, Global Active Archive of Large Flood Events, 2011. At: http://floodobservatory.colorado.edu/Archives/index.html.
COAG 2004, National Inquiry on Bushfire Mitigation and Management. At: www.coagbushfireenquiry.gov.au.
EMIDP 2006, Emergency Management Information Development Plan. At: www.abs.gov.au/AUSSTATS/abs@.nsf/Lookup/1385.0Main+Features12006?OpenDocument.
Guha-Sapir, D, Vos, F, Below, R & Ponserre, S 2011, The Trends and Numbers, Centre for Research on the Epidemiology of Disasters. Annual Disaster Statistical Review 2010.
IFRC 2012, International Federation of Red Cross and Red Crescent Societies (IFRC) World Disasters Report 2012. At: www.ifrc.org/publications-and-reports/world-disasters-report-2012.
Impacts Project 2012, Australian Natural Disasters Impacts Framework Project. At: www.fire.nsw.gov.au/page.php?id=914.
OECD 2003, Emerging Risks in the 21st Century: An Agenda for Action. At: www.oecd.org/futures/globalprospects/emergingrisksinthe21stcenturyanagendaforaction.htm.
Power, R, Robinson, B, Cameron, MA, & Nicolopoulos, N 2012, The Pilot Impacts Portal: Towards an Emergency Response Planning Tool. CSIRO, Canberra, Australia. At: https://publications.csiro.au/rpr/download?pid=csiro:EP1210307&dsid=DS1.
Queensland Government 2011, Budget Papers 2011–12 Budget Strategy and Outlook. At: www.budget.qld.gov.au/budget-papers/2011-12/bp2-2011-12.pdf.
RBA 2011, Box A: The Impact of the Recent Floods on the Australian Economy. Statement on Monetary Policy February 2011. At: www.rba.gov.au/publications/smp/boxes/2011/feb/a.pdf.
Stephenson, C 2010, Impacts Framework for Natural Disasters and Fire Emergencies. At: www.fire.nsw.gov.au/gallery/files/pdf/projects/indfe/Australian%20Natural%20Disasters%20Impacts%20Framework%20V%201.0.pdf.
Stephenson, C, Handmer, J & Haywood, A 2012, Estimating the net cost of the 2009 Black Saturday Bushfires to the affected regions. Technical report, RMIT, Bushfire CRC, Victorian DSE.
Victorian Government 2010, Final Report—2009 Victorian Bushfires Royal Commission. At: www.royalcommission.vic.gov.au.
Robert Power is a senior software engineer who has been with CSIRO for over 20 years. He is currently investigating the use of social networks to aid emergency management, Web interfaces to support disaster planning and issues of data integration.
Bella Robinson is a senior software engineer who has been with CSIRO for 17 years. Her areas of interest include spatial information systems, internet applications and social media analysis.
Mark Cameron is a research team and project leader who has been with CSIRO for over 20 years. He is currently leading a team developing a platform and tools to deliver situation awareness from near real-time social-media text streams. Mark has extensive experience in research and development of tools and platforms to enable automated information integration.
Nick Nicolopoulos is Principal Strategist Business Intelligence and Decision Support with Fire and Rescue NSW. He has over 25 years experience in leading statistical research projects, and in developing frameworks, standards, policies and systems to improve data governance and business intelligence for the emergency management sector.
1 http://developer.yahoo.com/geo/geoplanet/
2 The disaster event information contained in the Disaster Database has been integrated into the Australian Emergency Management Knowledge Hub, as of July 2012. The Knowledge Hub is a fully searchable online resource for emergency management information, research and media. www.emknowledge.gov.au